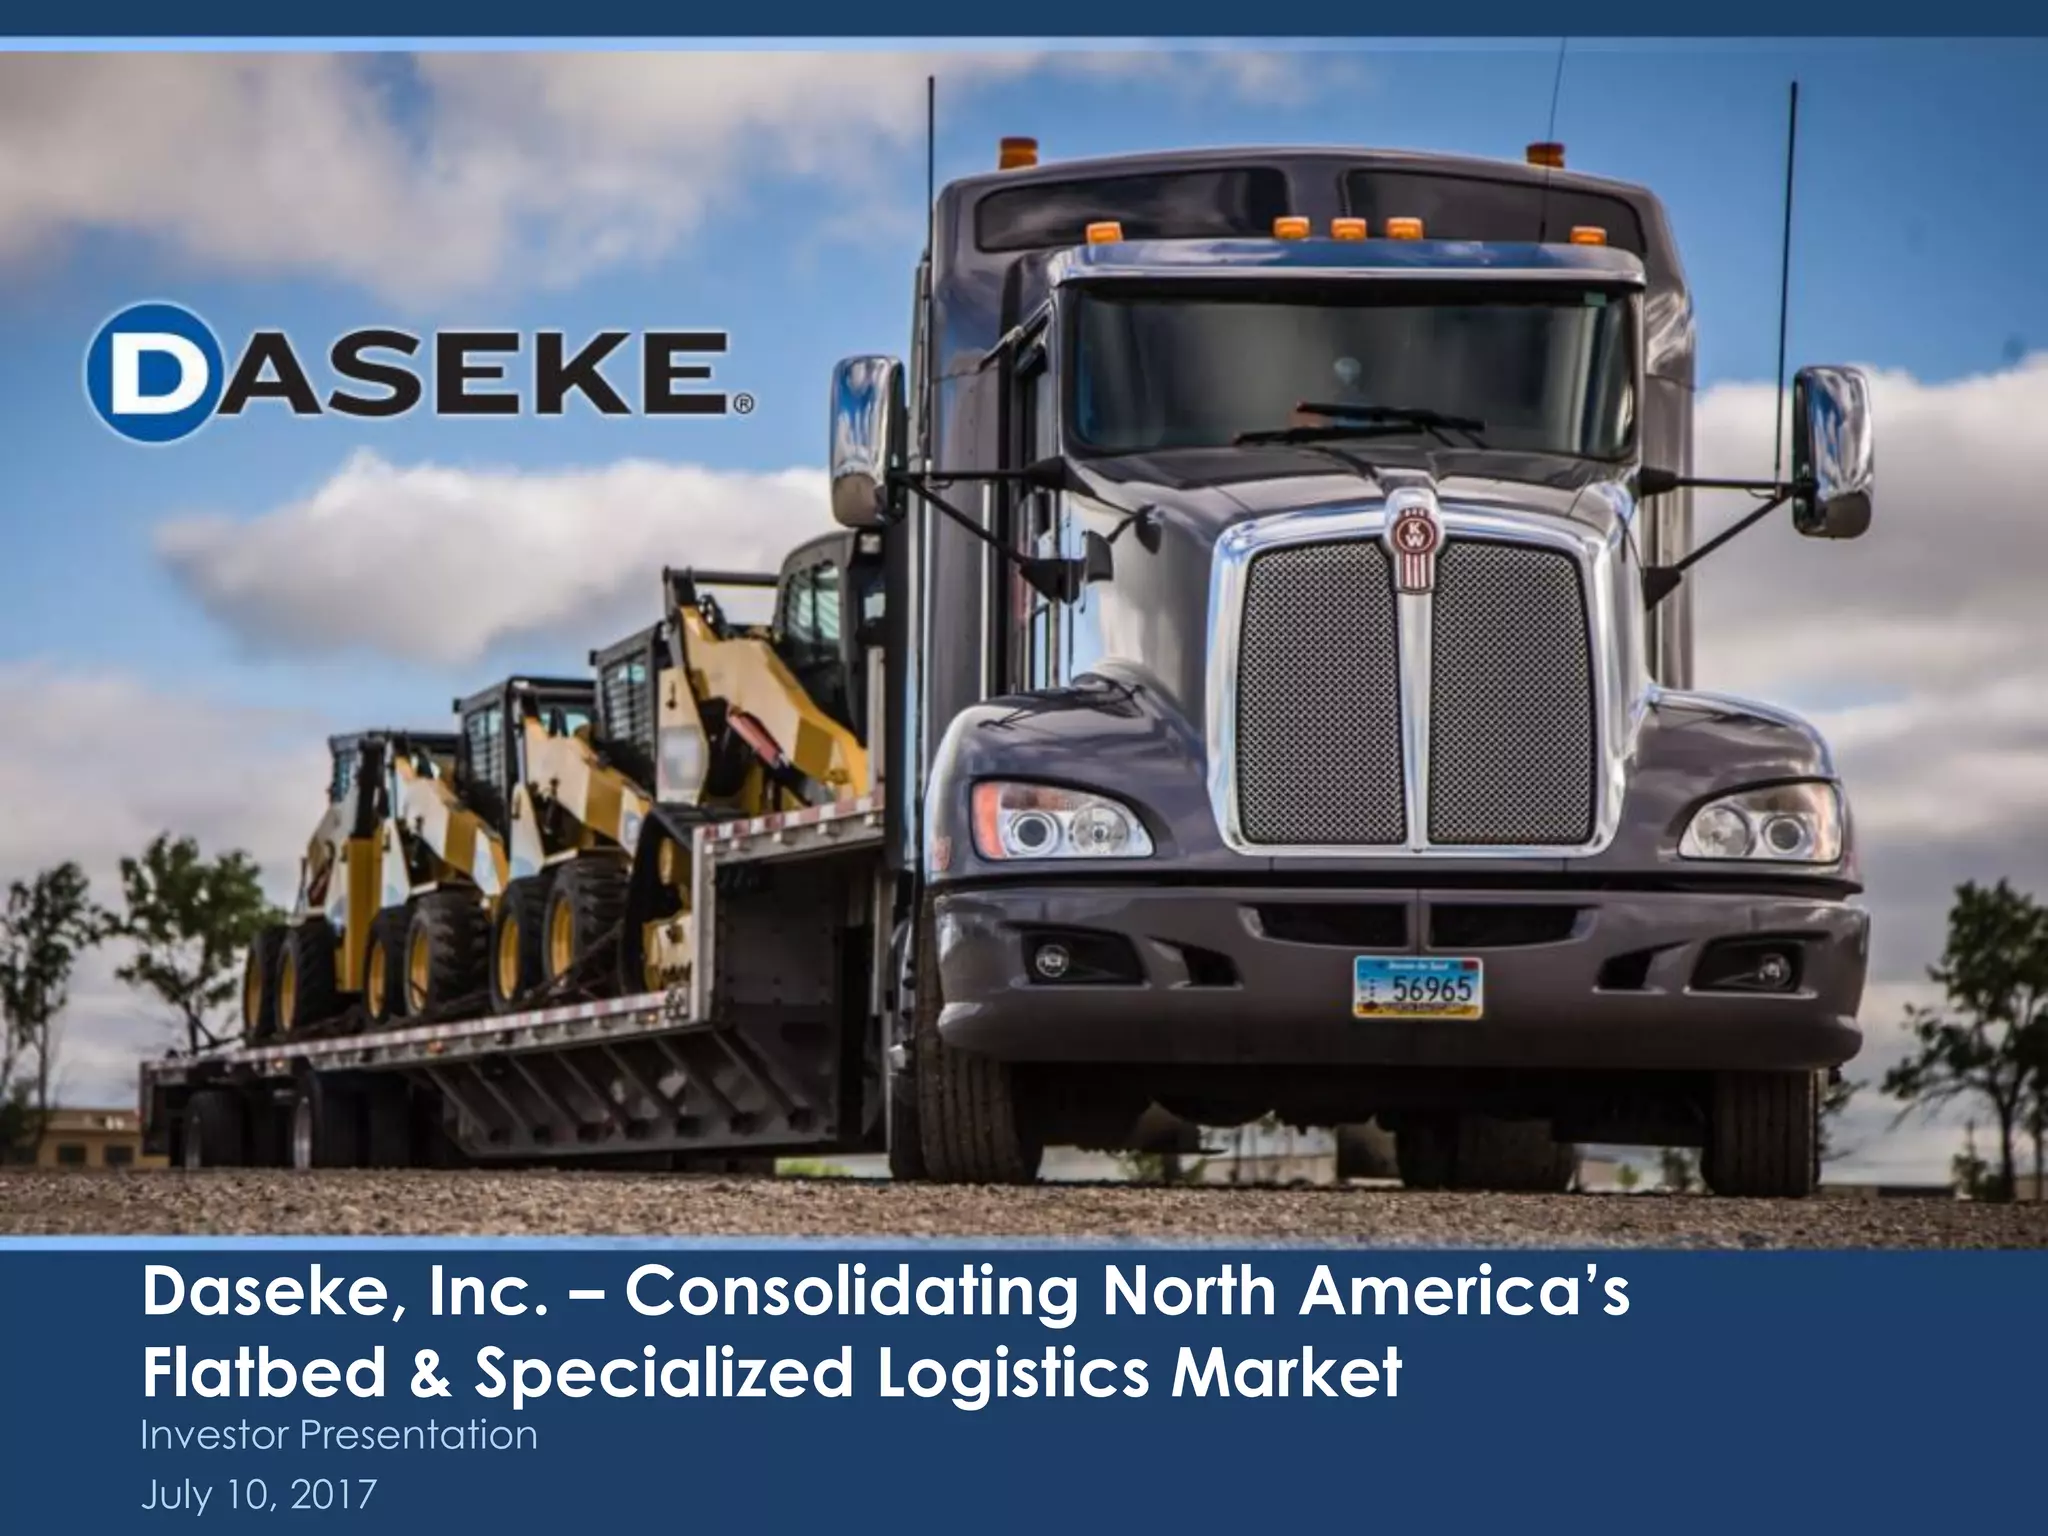
Daseke, Inc. presents a compelling case for industrial consolidation in the specialized logistics sector. The deck highlights a 50% Adjusted EBITDA CAGR from 2009 to 2016 and positions the company as the largest owner of flatbed equipment in North America. Despite this scale, Daseke notes it holds less than 1% of the $133 billion market, suggesting significant headroom for further M&A. The presentation is heavily weighted toward financial metrics, utilizing pro forma targets to account for recent and planned acquisitions. A notable feature is the detailed earnout structure on slide 14, which…
Key takeaways
- Daseke achieved a 50% Adjusted EBITDA CAGR between 2009 and pro forma 2016 (Slide 2).
- The company identifies as the largest owner of flatbed and specialized equipment in North America but holds less than 1% of the $133 billion market (Slide 2).
- Management maintains high skin in the game, owning approximately 60% of the company (Slide 2).
- The business model is 'Asset Right,' with 66% of operations being asset-based and 34% asset-light, including brokerage and owner-operators (Slide 6).
- Revenue is perfectly split 50/50 between Flatbed and Specialized segments as of Q1 2017 (Slide 6).
- End-market diversification is broad, with Metals (24%) and Building Materials (19%) being the largest contributors (Slide 8).
- Pro forma revenue targets for 2017 were set at $979 million, a significant jump from $652 million in 2016 (Slide 12).
- A structured earnout plan offers up to 15 million shares to management based on hitting EBITDA targets of $140M, $170M, and $200M through 2019 (Slide 14).
Daseke, Inc. Investor Presentation Analysis
The July 10, 2017 investor presentation for Daseke, Inc. is a detailed look at a company in the midst of a rapid consolidation phase. Daseke positions itself not just as a trucking company, but as a specialized logistics powerhouse capable of handling complex, 'open deck' freight that traditional van carriers cannot. The deck is heavily focused on financial performance, pro forma projections, and management alignment, which is typical for a company that has recently gone public or is seeking significant institutional investment to fuel further M&A.
Slide 1: Title and Positioning
The cover slide establishes the company's core value proposition: "Consolidating North America’s Flatbed & Specialized Logistics Market." The imagery of a Kenworth truck hauling multiple pieces of heavy machinery immediately communicates the 'Specialized' nature of their business. The date, July 10, 2017, places this deck in a period of significant industrial expansion in the U.S.
Slide 2: The Daseke Opportunity
This is the 'Executive Summary' slide, and it is dense with high-impact metrics. Daseke highlights a 50% Adjusted EBITDA CAGR from 2009 to pro forma 2016. It claims the title of the "Largest owner of flatbed and specialized equipment in North America," yet emphasizes the massive opportunity for growth by noting they have less than 1% market share of a $133 billion market. The slide also addresses governance and alignment, noting that management owns ~60% of the company and the CEO is under a three-year lock-up. This is designed to reassure investors that the leadership is committed to long-term value rather than a quick exit.
Slide 4: Defining the Niche: What is Open Deck
For investors unfamiliar with the logistics sector, slide 4 provides a visual primer on 'Open Deck' transportation. It categorizes their services into six types: Flatbed, Step Deck, Over Dimensional, Super Heavy Haul, High Value Customized, and RGN (Removable Gooseneck) . The photos show complex loads like wind turbine blades and aircraft parts, which serves to differentiate Daseke from commodity 'dry van' trucking. This specialization usually commands higher margins and creates higher barriers to entry due to the equipment and driver expertise required.
Slide 6: Operational Scale and Model
This slide provides the hard numbers behind the operation. Daseke reports owning over 3,600 tractors and 7,500 open deck trailers . The revenue is perfectly balanced, with a 50/50 split between Flatbed and Specialized segments. Crucially, they describe their "Asset Right Operating Model," which is 66% asset-based and 34% asset-light (brokerage and owner-operators). This mix suggests the company can maintain core capacity while using brokerage to handle overflow and seasonal spikes without carrying the full capital expense of those extra trucks year-round.
Slide 8: End-Market Diversification
To prove they aren't overly dependent on a single industry, Daseke provides a revenue mix by end-market. As of Q1 2017, the mix includes Metals (24%), Building Materials (19%), Heavy Equipment & Energy (16%), and Lumber (10%) . Smaller segments like Aircraft Parts (9%) and Concrete Products (4%) round out the portfolio. This diversification is a key selling point for industrial investors, as it suggests the company can weather a downturn in one specific sector (like energy) if others (like building materials) remain strong.
Slide 10: Appendix Transition
Slide 10 is a simple divider for the Appendix. In many professional investor decks, the most critical financial data is moved to the appendix to keep the main narrative flow clean, while still providing the transparency required for due diligence.
Slide 12: Key Metrics and Financials
This slide contains the 'meat' of the financial argument. It shows a steady climb in revenue from $207 million in 2013 to a pro forma 2017 target of $979 million . Adjusted EBITDA shows a similar trajectory, targeting $140 million in 2017. The Free Cash Flow chart is particularly interesting, showing a jump from $3 million in 2013 to a projected $75 million in 2017. The deck also tracks Net Capital Expenditures as a percentage of revenue, showing a downward trend from 13% in 2014 to a projected 7% in 2017, suggesting increasing capital efficiency as the company scales.
Slide 14: Management Earnout Details
The final slide in this selection is a detailed table regarding the 'Earnout Structure.' It explicitly links management's stock awards to both financial performance and market valuation. To receive the full 15 million shares, the company must hit an Adjusted EBITDA target of $200 million and a stock price target of $16.00 by 2019 . This slide is a powerful tool for building investor trust, as it shows that management only wins if the shareholders win through both earnings growth and share price appreciation.
What Makes This Deck Effective
Daseke’s presentation is a textbook example of a 'Consolidator' pitch. It successfully balances the narrative of being a market leader with the narrative of being an underdog with massive growth potential. By highlighting the <1% market share , they turn their large size into a proof-of-concept rather than a ceiling. The use of pro forma numbers is essential here because Daseke is an M&A-driven story; showing only historical GAAP numbers would fail to capture the true earning power of the newly integrated entities.
What Is Missing from the Deck
While the financial data is robust, there are a few notable omissions in these 8 slides. First, there is no specific 'Team' slide detailing the backgrounds of the executive leadership beyond the CEO. In a roll-up strategy, the M&A and integration experience of the team is paramount. Second, there is no explicit 'Ask' slide in this selection. While it is an 'Investor Presentation,' it doesn't specify if they are raising a specific round of debt or equity, or if this is a general update for public markets. Finally, there is no mention of the competitive landscape . While they mention they are the 'largest,' they do not name the next 5-10 competitors they are fighting against for market share or acquisition targets.
Lessons for Founders
Founders building in fragmented industries should study Daseke’s approach to market sizing. Instead of just stating the Total Addressable Market (TAM), Daseke shows their current penetration relative to that TAM to illustrate the 'runway' for growth. Additionally, the Asset Right model is a great way to frame a business that has high capital requirements; it shows investors that you are thinking about capital efficiency and scalability, not just buying more equipment. Finally, if you are in a post-merger or high-M&A phase, using pro forma targets (with clear footnotes) is the best way to communicate the 'new reality' of your business to potential investors.
Frequently asked questions
- What is Daseke's core growth strategy according to the deck?
- Daseke’s strategy is built on consolidation. Slide 6 notes they have already acquired and integrated 12 companies. By targeting the highly fragmented $133 billion open deck market where they currently hold less than 1% share, the company aims to use its scale to capture more of the North American logistics landscape through aggressive M&A and organic growth.
- How does Daseke balance its operational assets?
- The company employs an 'Asset Right' operating model. According to slide 6, 66% of their operations are asset-based, utilizing company-owned equipment (over 3,600 tractors and 7,500 trailers). The remaining 34% is asset-light, consisting of brokerage services and owner-operators, which allows for flexibility and scalability without the capital intensity of full ownership.
- What are the primary industries served by Daseke?
- Daseke serves a highly diversified set of end-markets to mitigate cyclical risks. Slide 8 shows that as of Q1 2017, the largest sectors were Metals (24%), Building Materials (19%), and Heavy Equipment & Energy (16%). Other significant sectors include Lumber (10%), Aircraft Parts (9%), and Concrete Products (4%).
- What financial targets did Daseke set for the 2017-2019 period?
- The deck outlines aggressive growth targets. Slide 12 projects 2017 pro forma revenue at $979 million and Adjusted EBITDA at $140 million. Slide 14 further extends these targets for the management earnout, setting an Adjusted EBITDA goal of $170 million for 2018 and $200 million for 2019, tied to stock price targets of $14.00 and $16.00 respectively.
- How is management incentivized in this presentation?
- Management alignment is a core theme. Slide 2 mentions that CEO Don Daseke has a three-year lock-up on his shares. Furthermore, slide 14 details a 'Unique Earnout Structure' where management can receive up to 15 million shares of common stock, but only if they hit specific, escalating Adjusted EBITDA and stock price targets through 2019.