Broadwind Energy (BWEN) presented a mixed-outlook deck in late 2015, characterized by extreme transparency regarding operational struggles. While the company boasted a $241 million revenue base in 2014 (Slide 3) and a sold-out 2015 tower production capacity (Slide 5), it simultaneously admitted to production difficulties and a sharp decline in its gearing segment due to the oil and gas downturn. The deck is a masterclass in 'bad news' management, using detailed balance sheet data (Slide 11) to prove liquidity while lowering Q3 2015 estimates. It highlights a 58% reduction in wind energy costs…
Key takeaways
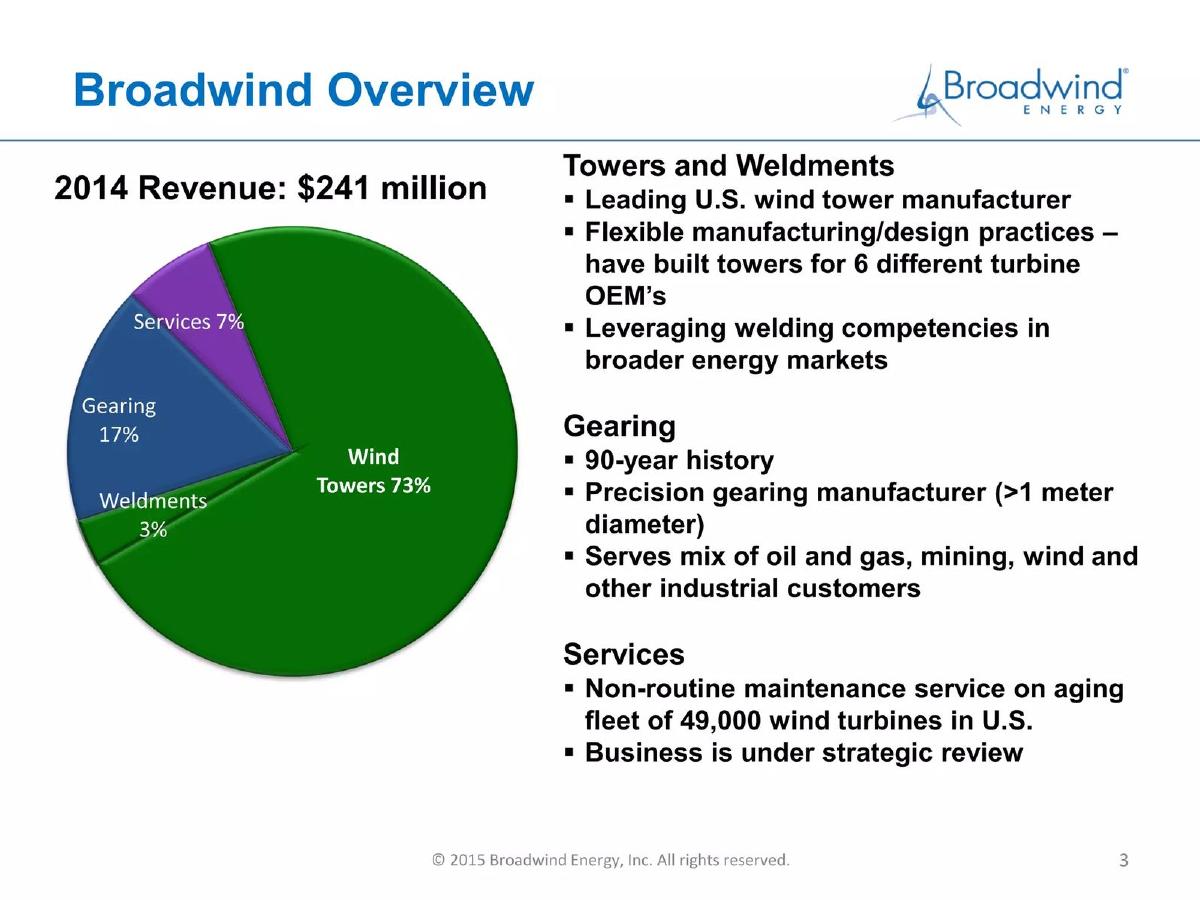
- Broadwind reported 2014 revenue of $241 million, with Wind Towers accounting for 73% of the business (Slide 3).
- The company faced significant production issues in 2014-2015, citing supply chain, steel, and paint tactical problems (Slide 9).
- Wind energy cost competitiveness is a core thesis, showing a 58% LCOE reduction over five years to $37-$81/MWh (Slide 7).
- The Gearing segment suffered heavily from the oil and gas downturn, with orders dropping from $18.5 million in Q2 2014 to just $3.9 million in Q2 2015 (Slide 17).
- Liquidity was a primary focus, with a projected year-end 2015 cash balance exceeding $10 million (Slide 11).
- The Services business was placed under 'strategic review' and eventually treated as a discontinued operation in financial outlooks (Slide 3, 13).
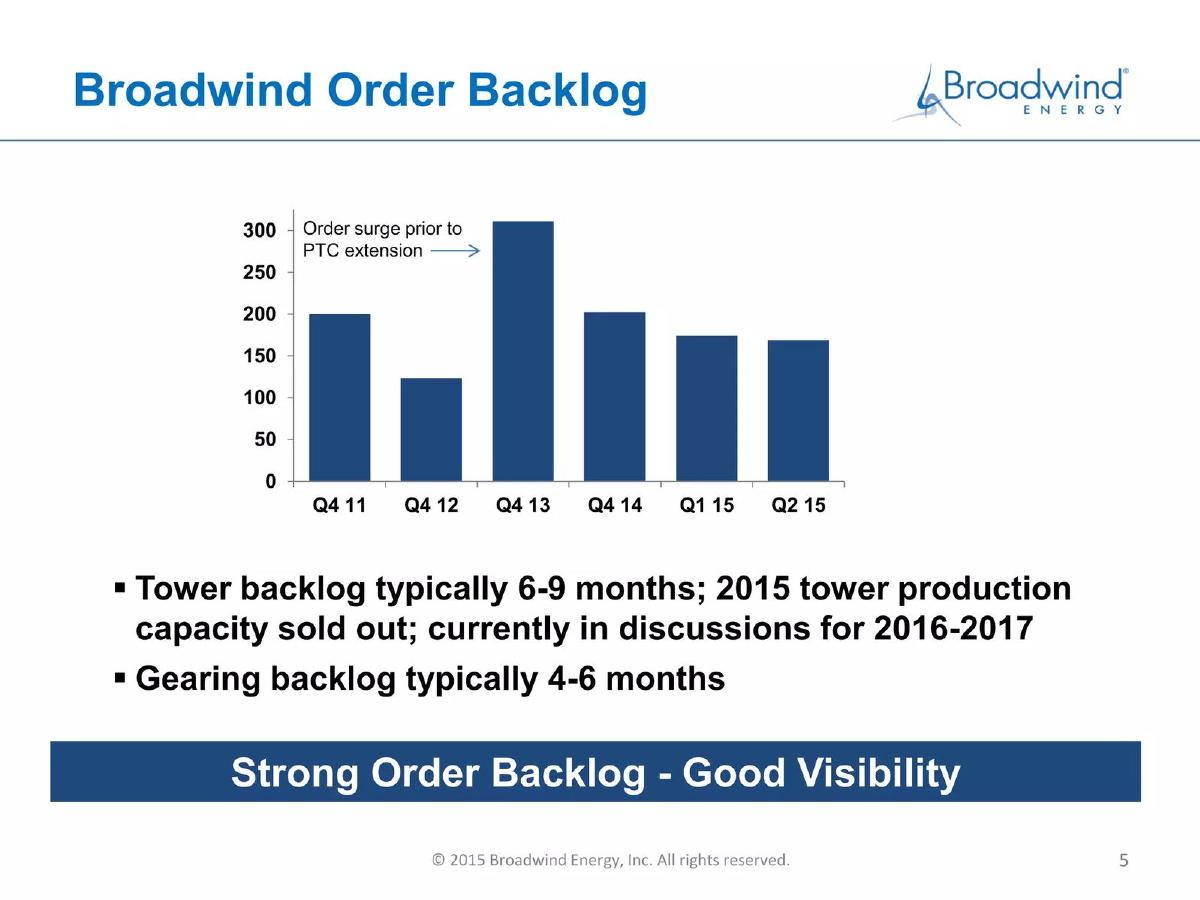
- Tower production capacity for 2015 was fully sold out, providing high visibility for the largest revenue segment (Slide 5).
- Q3 2015 financial outlook was reduced in September 2015 to a projected operating loss of $3.0-$4.0 million (Slide 13).
Broadwind Energy: A Study in Public Market Transparency
The Broadwind Energy presentation for the Aegis Growth Conference in October 2015 is not a traditional 'visionary' startup deck. Instead, it is a detailed operational update for a public company (NASDAQ: BWEN) navigating a complex industrial landscape. The deck is characterized by its willingness to address failure head-on, specifically regarding production bottlenecks and segment-wide downturns.
Slide 1: Title and Branding
The cover slide establishes Broadwind Energy as a diversified player in the energy and infrastructure space. The imagery on the left—gears, oil rigs, mining trucks, and wind turbines—corresponds directly to the business segments detailed later in the deck. It is a functional, if uninspired, entry point that sets a professional tone for institutional investors.
Slide 3: Broadwind Overview
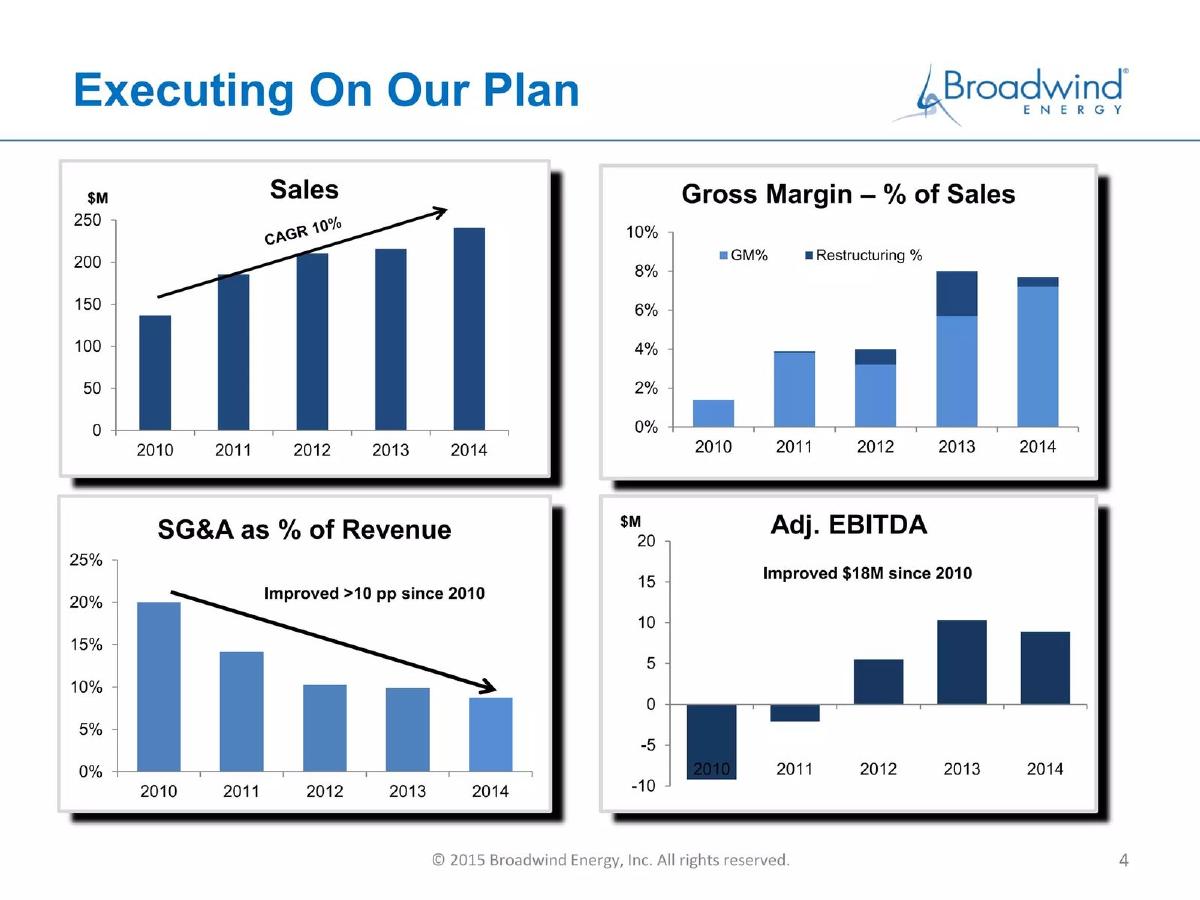
This slide provides the essential 'what we do' breakdown. The company reported $241 million in 2014 revenue . The revenue mix is heavily weighted toward Wind Towers (73%) , followed by Gearing (17%) , Services (7%) , and Weldments (3%) . Key takeaways here include Broadwind's status as a 'Leading U.S. wind tower manufacturer' and the mention that the Services business is 'under strategic review,' a common euphemism for a segment the company is looking to exit or restructure.
Slide 5: Order Backlog and Visibility
Broadwind uses a bar chart to show order backlog from Q4 2011 through Q2 2015. While the backlog peaked in Q4 2013 (exceeding $300 million due to a surge prior to a PTC extension), it remained stable at approximately $175 million in mid-2015. The most critical data point here is that 2015 tower production capacity was sold out , providing investors with high revenue visibility despite other operational headwinds.
Slide 7: The Macro Case for Wind
To justify their heavy reliance on the wind sector, Broadwind presents a chart showing a 58% reduction in the Unsubsidized Levelized Cost of Energy (LCOE) over five years. By 2014, wind energy costs ($37-$81/MWh) were shown to be competitive with Gas Combined Cycle ($61-$87/MWh). This slide serves to de-risk the company's primary revenue stream by proving that wind is economically viable even without government incentives (PTC).
Slide 9: Addressing Production Difficulties
This is a rare 'honesty slide.' The headline explicitly states, 'We have encountered difficulties increasing tower production to meet demand.' It lists tactical issues with the supply chain, steel, and paint. By acknowledging these '2014-15 Production Issues' and showing a chart of increasing tower production (projected to reach nearly 500 units in 2015), the company attempts to frame these failures as growing pains rather than systemic flaws.
Slide 11: Liquidity and Balance Sheet
For a company facing production issues, cash is king. This slide provides a detailed balance sheet comparison. A key highlight is the Cash Assets row: Broadwind started 2015 with $20.2 million, dipped to a precarious $232,000 in March, and projected a recovery to >$10,000,000 by year-end . The slide also notes that a $2.6 million loan will be forgiven in 2018, adding a layer of future financial stability.
Slide 13: Q3 Financial Outlook
This slide delivers the 'bad news' regarding the current quarter. Broadwind reduced its Q3 outlook in September 2015, projecting an Operating Loss of $3.0-$4.0 million . The reasons cited include production difficulties in the tower business and a downturn in the oil and gas markets affecting the gearing segment. Notably, the figures exclude the 'unprofitable Services segment,' indicating a shift toward a leaner core business.
Slide 15 & 17: The Gearing Segment and Appendix
The Gearing slide (Slide 17) illustrates the impact of the broader industrial recession. Orders dropped from $18.5 million in Q2 2014 to $3.9 million in Q2 2015 . The company highlights its 2015 objectives: cross-training labor, tight expense control, and expanding sales efforts to improve capacity utilization. The shift in 'Orders by Industry' pie charts shows a move away from Oil & Gas toward a more balanced mix including Steel and Industrial customers.
Slide 19: Conclusion
The final slide reiterates the mission statement: helping customers maximize performance 'quicker, easier and smarter.' It features high-quality photography of the company’s three main touchpoints: tower interiors, precision gearing, and field services.
What Broadwind Energy Does Well
Broadwind excels at segmental transparency . Many companies attempt to hide a failing division behind the success of a larger one. Broadwind does the opposite, clearly demarcating the 'sold out' success of its Wind Tower business from the 'down sharply' reality of its Gearing segment. This allows investors to value the company as a sum-of-parts rather than a monolithic failure.
The use of LCOE data (Slide 7) is also highly effective. By showing that their primary market is cost-competitive with fossil fuels without subsidies, they remove a major political risk factor from the investor's mind. Furthermore, the Liquidity slide (Slide 11) is exceptionally detailed for a conference deck, providing month-by-month asset and liability tracking that builds trust during a period of operational volatility.
Omissions and Weaknesses
The most glaring omission in this 10-slide selection is the Team Slide . While Broadwind is a public company and executive bios are available in SEC filings, a conference deck should still highlight the leadership responsible for navigating the 'production difficulties' mentioned on Slide 9. Without seeing the management team, the deck feels like a report from a machine rather than a plan from a leadership group.
Additionally, the deck lacks a Competitive Landscape analysis. While they claim to be a 'Leading U.S. wind tower manufacturer,' they do not name their competitors or explain their specific moat (e.g., geographic advantage, proprietary welding techniques, or exclusive OEM contracts). In a commodity-adjacent business like steel fabrication, the lack of a clear 'why us' beyond 'we are already here' is a weakness.
Lessons for Founders
Own your failures: If your production is lagging or a segment is dying, address it before the investor asks. Broadwind’s Slide 9 and Slide 13 are excellent examples of how to frame bad news within a context of resolution and strategic pivots. · Use macro data to support micro claims: Broadwind doesn't just say 'wind is good.' They show the LCOE dropping 58% over five years. If you are in a specific niche, use third-party data to prove the niche is growing or becoming more efficient. · Visibility is a metric: Broadwind highlights their 'sold out' capacity. For a startup, this translates to 'Letter of Intent' (LOI) value or a waitlist. Showing that you have more demand than you can currently handle is a powerful way to justify a request for capital to expand production. · Balance Sheet as a narrative: Don't just show a 'Use of Funds' chart. Show how your assets and liabilities are evolving. Broadwind’s Slide 11 shows a company that knows exactly where every dollar is, which is the best way to reassure nervous investors.
Frequently asked questions
- What was the primary driver of Broadwind's revenue in 2015?
- According to Slide 3, Wind Towers were the primary driver, representing 73% of the company's $241 million revenue in 2014. The deck emphasizes that this segment was the most stable, with 2015 production capacity completely sold out and a typical backlog of 6-9 months (Slide 5).
- How did Broadwind address its manufacturing failures?
- Broadwind used Slide 9 to explicitly list '2014-15 Production Issues,' including tactical problems with supply chain, steel, and paint. They framed these as 'resolved in the short-term' while admitting that supply chain globalization had lengthened the process for securing 2016 capacity.
- What was the status of the Gearing segment during this presentation?
- The Gearing segment was in a state of sharp decline due to the downturn in oil, gas, and mining. Slide 17 shows that orders fell by 79% year-over-year in Q2. The company responded by consolidating plants and implementing aggressive cost management to narrow operating losses.
- What was the company's liquidity position at the time of the deck?
- Broadwind emphasized a strengthening cash position on Slide 11. While cash assets were as low as $232,000 in March 2015, they grew to $591,000 by June and were projected to exceed $10 million by the end of 2015, supported by customer deposits and debt management.
- Does the deck include information about the leadership team?
- No. The 10 slides provided from the 19-slide deck omit a team or management slide entirely. The focus is strictly on operational metrics, segment performance, and financial statements, which is typical for a public company investor relations presentation rather than a startup pitch.