Crestwood’s December 2017 investor deck is a data-heavy presentation designed for sophisticated energy sector investors. It moves quickly past high-level vision to focus on specific infrastructure projects, volume growth metrics, and balance sheet health. The company highlights a self-funded capital program and significant insider ownership (32% LP units) to align with investors. By providing detailed project timelines, such as the two-phase Bear Den Processing Plant, and specific volume growth figures (e.g., +215% YTD in the Delaware Basin), Crestwood builds a case for predictable, accretive…
Key takeaways
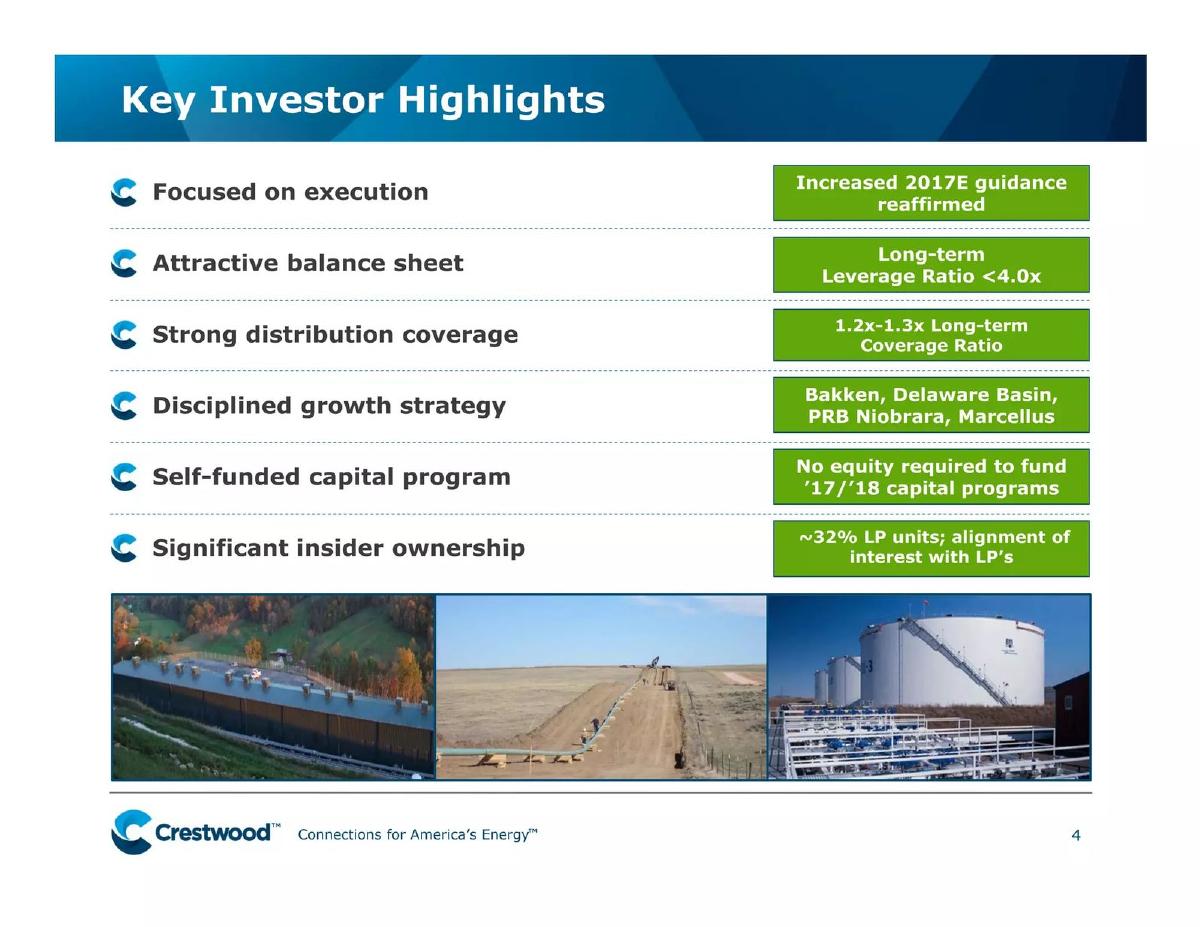
- The company emphasizes a self-funded capital program, stating no equity is required to fund 2017/2018 programs (Slide 4).
- Volume growth is a central theme, with the Delaware Basin showing a massive +215% YTD increase as of late 2017 (Slide 7).
- Insider alignment is quantified at approximately 32% LP units, signaling strong management conviction (Slide 4).
- Infrastructure projects are broken down by cost and capacity, such as the $115MM Phase 1 Bear Den plant (Slide 13).
- The deck provides specific forward-looking guidance, including a targeted leverage ratio of <4.0x and a 1.2x-1.3x coverage ratio (Slide 4).
- Strategic partnerships are highlighted, specifically the Jackalope G&P JV where Crestwood and Williams each own 50% (Slide 19).
- The investment opportunity is framed around a 9.8% current yield as of December 2017 (Slide 25).
- Operational transparency includes mapping specific pipeline routes and processing plant locations in the Delaware Basin (Slide 16).
Crestwood Investor Presentation: A Deep Dive into Midstream Infrastructure
The Crestwood investor presentation from December 2017 is a technical, data-driven document designed for institutional investors and analysts in the energy sector. Unlike early-stage startup decks that focus on 'disruption' and 'vision,' this deck focuses on 'execution,' 'yield,' and 'asset-level fundamentals.' It serves as a progress report and a roadmap for a company managing billions in physical infrastructure.
Slide 1: Title Slide
The cover is professional and minimalist, featuring the Crestwood logo and the tagline "Connections for America’s Energy™." The date, December 2017, establishes the context for the operational data that follows. There are no distractions here; the focus is immediately on the corporate identity.
Slide 4: Key Investor Highlights
This slide serves as the executive summary. It lists six pillars of the investment thesis: execution, balance sheet health, distribution coverage, growth strategy, self-funding, and insider ownership. Crucially, it notes that ~32% of LP units are held by insiders , which is a significant metric for alignment of interest. It also sets clear financial guardrails: a long-term leverage ratio of <4.0x and a coverage ratio of 1.2x-1.3x. The mention of a "self-funded capital program" with "no equity required" for 2017/2018 is a strong signal to the market that the company is not looking to dilute shareholders to fund its projects.
Slide 7: Improved Fundamentals Drive Volume Growth
This is one of the most data-dense slides in the deck. It tracks oil, gas, and water volumes across six different basins: Bakken (Oil and Gas), Delaware Basin, PRB Niobrara, SW Marcellus, and Barnett. The standout figure is the +215% YTD volume growth in the Delaware Basin. The slide uses sparklines to show trends since FY 2016, providing visual proof of the 'up and to the right' narrative. It also includes specific operational 'System Drivers,' such as the number of well connects (100-110 in Bakken) and active rigs (3 in PRB Niobrara), which gives investors a way to verify the growth projections.
Slide 10: Attractive Set of Near-term Organic Growth Projects
This is a transition slide featuring a high-resolution photo of pipeline construction. It reinforces the physical nature of the business. The term "Organic Growth" is important here, as it suggests the company is growing by expanding its own footprint rather than relying solely on expensive acquisitions.
Slide 13: Arrow Bear Den Processing Plant
Crestwood zooms in on a specific asset here. The Bear Den plant is presented as a two-phase solution. Phase 1 cost $115MM and was commissioned in late November 2017 , while Phase 2 is targeted for Q2 2019 with an expected cost of ~$185MM. The slide provides a clear 'Project Rationale,' explaining how the plant improves competitive position and allows Crestwood to 'control its own destiny' by processing the volumes it gathers. The inclusion of a site photo adds a layer of 'boots on the ground' reality to the financial figures.
Slide 16: Orla Express Pipeline & Orla Processing Plant
Similar to the Bear Den slide, this focuses on the Delaware Basin. It includes a detailed map showing the 33 miles of 20-inch pipeline and the 200 MMcf/d cryogenic gas plant. The slide notes a base scope capital of ~$170 million and mentions that the plant is expandable to 600 MMcf/d. This 'expandability' is a key selling point, as it suggests future growth can be achieved with lower incremental capital expenditure.
Slide 19: PRB Niobrara – Jackalope G&P JV
This slide highlights a joint venture (JV) with Williams, where Crestwood owns 50%. It focuses on a 20-year fixed fee contract with Chesapeake, a major producer. The slide provides granular data on the acreage (388K dedicated acres) and drilling locations (2,600). The chart 'CHK PRB Net Production Potential' shows a steep projected increase in volumes through Q4 2019 , backed by the fact that Chesapeake was running 3 rigs on the system at the time.
Slide 22: Balance Sheet Strength, Disciplined Capital Allocation
Another transition slide, this time featuring an aerial view of a well pad and storage tanks. It introduces the final section of the deck, which focuses on the financial health and the 'Accretive DCF (Distributable Cash Flow) Growth' that results from the previously discussed projects.
Slide 25: The Crestwood Investment Opportunity
The deck concludes with a summary of the investment case. It reiterates the self-funded nature of the growth and the long-term pipeline projects. The most important figure here is the 9.8% current yield (as of 12/1/2017). It positions Crestwood as a high-yield play with a 'strong contract portfolio' and 'no incentive distribution rights,' which is a structural advantage in the MLP (Master Limited Partnership) world. The final takeaway is that 'Cash flow per unit growth to resume in 2018,' providing a clear catalyst for investors to buy in now.
What Crestwood Does Well
Crestwood excels at asset-level transparency . In the midstream space, investors are often wary of 'black box' portfolios. Crestwood avoids this by providing specific maps, project costs, commissioning dates, and volume growth percentages for every major basin they operate in. By breaking down the $115MM and $185MM costs for the Bear Den phases, they show they have a firm grasp on their capital expenditure.
The deck also does a masterful job of aligning management with shareholders . Citing the 32% insider ownership multiple times throughout the deck (and in the highlights) serves to reassure investors that the people running the company will feel the same pain or gain as the LPs. Furthermore, the focus on 'self-funding' addresses a common criticism of the MLP model—that companies are 'equity junkies' constantly issuing new shares to pay for growth.
What is Missing from the Deck
While this selection of slides is highly informative, there are a few standard elements missing that would typically appear in a full investor deck. First, there is no dedicated 'Management Team' slide in this 9-slide sample. While the company is established, new investors still want to see the track records of the CEO and CFO. Second, there is a lack of detailed competitor benchmarking . While they mention a 'Peer Group' on Slide 25, they don't explicitly name the peers or show a side-by-side comparison of metrics like EV/EBITDA or yield. Finally, the deck is light on ESG (Environmental, Social, and Governance) metrics , which, even in 2017, were becoming increasingly important for energy infrastructure companies.
What a Founder Should Copy
Founders in capital-intensive industries (like infrastructure, manufacturing, or hardware) should study how Crestwood quantifies their growth drivers . Instead of saying "we are growing fast," Crestwood says "Delaware Basin +215% YTD volume growth." Instead of saying "we have a big pipeline," they provide a map with the exact mileage and pipe diameter. This level of specificity builds immense credibility.
Additionally, the use of 'Project Rationale' boxes (as seen on Slide 13) is a great way to explain the 'why' behind a capital spend. It connects the technical specs of a project to the strategic goals of the company, making it easier for a non-technical investor to understand the value proposition. Finally, the clear statement of financial guardrails (leverage and coverage ratios) is something every founder should have; it shows that you aren't just chasing growth at any cost, but growth within a disciplined financial framework.
Frequently asked questions
- What is Crestwood's primary business model based on this deck?
- Crestwood operates in the midstream energy sector, focusing on gathering and processing (G&P) infrastructure. They provide the 'connections for America's energy' by building and operating pipelines and processing plants that move oil, natural gas, and water from wellheads to market. Their revenue is driven by volume throughput and long-term fee-based contracts, as seen in their 20-year fixed fee contract with Chesapeake.
- How does Crestwood address financial risk and leverage?
- The deck explicitly targets a long-term leverage ratio of less than 4.0x and a distribution coverage ratio between 1.2x and 1.3x. By emphasizing a 'self-funded capital program,' they signal to investors that they intend to grow without diluting existing shareholders through new equity issuances, relying instead on internal cash flow and existing balance sheet capacity.
- Which geographic regions are most important to Crestwood's growth?
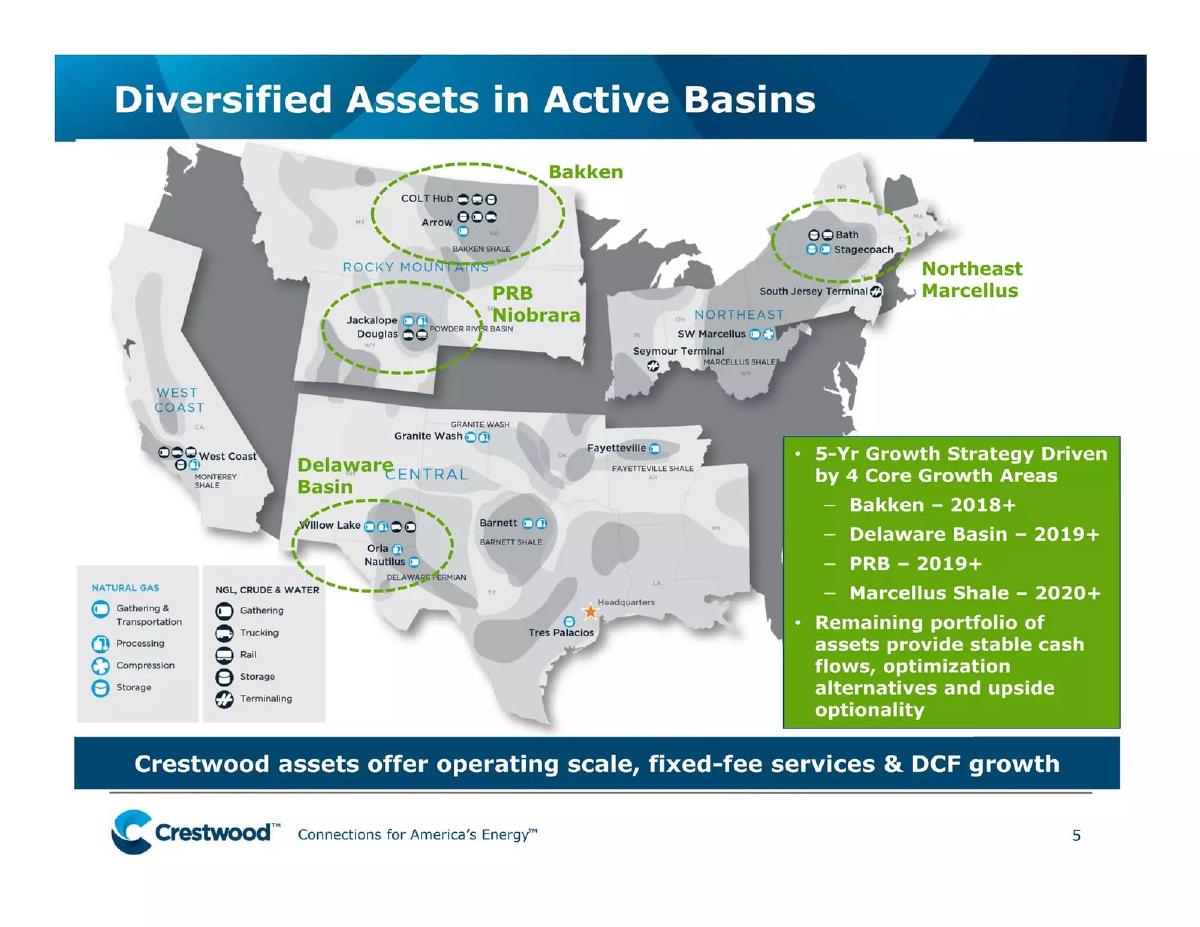
- Based on the volume growth and project slides, the Bakken (North Dakota) and the Delaware Basin (Texas/New Mexico) are the primary drivers. The Delaware Basin is particularly notable for its 215% YTD volume growth. They also maintain significant footprints in the PRB Niobrara (Wyoming), the Marcellus (Northeast), and the Barnett (Texas) shale plays.
- What specific infrastructure projects are highlighted as growth drivers?
- Key projects include the Bear Den Processing Plant in the Bakken, which has a combined capacity of 150 MMcf/d across two phases, and the Orla Express Pipeline and Processing Plant in the Delaware Basin. The Orla plant has an initial 200 MMcf/d capacity, expandable to 600 MMcf/d, representing a significant capital investment of approximately $170 million.
- What is the 'ask' or the value proposition for new investors?
- The deck concludes by framing the opportunity as a high-yield investment (9.8% yield) with significant upside as cash flow per unit growth was expected to resume in 2018. They argue that their diversified business mix, lack of incentive distribution rights (IDRs), and alignment with commodity price improvements make them an attractive alternative to their peer group.