Crestwood’s November 2018 investor presentation is a dense, data-driven document designed for institutional energy investors. Rather than focusing on a 'problem/solution' narrative typical of tech startups, it emphasizes operational execution and regional dominance across key U.S. shale basins like the Bakken and Delaware. The deck highlights a tightened Adjusted EBITDA guidance of $400 million to $420 million for 2018 (Slide 25) and projects significant volume growth, including a 240% increase in Bakken water volumes from 2017 to 2019 (Slide 9). While the deck lacks a traditional team slide…
Key takeaways
- The company tightened its 2018 Adjusted EBITDA guidance to a range of $400 million to $420 million (Slide 5).
- Bakken water volumes are projected to grow by 240% between 2017 and 2019, significantly outpacing oil and gas growth in the same region (Slide 9).
- Operational efficiency is highlighted by a 14% reduction in combined O&M and G&A expenses compared to Q3 2017 (Slide 5).
- The business model relies on a three-tier integrated strategy: wellhead services, hub/trucking services, and premium downstream connectivity (Slide 17).
- Crestwood leverages third-party operator success, citing Anadarko's 300,000 gross acres and Devon Energy's rig count as growth catalysts (Slide 21).
- Financial health is measured by a target distribution coverage ratio of greater than 1.2x and a leverage ratio between 4.0x and 4.5x (Slide 25).
- The deck identifies specific asset divestitures, such as US Salt for $225 million and West Coast NGL assets for $70 million, to refine the portfolio (Slide 25).
- Growth capital for 2018 was revised upward to a range of $300 million to $350 million, indicating aggressive infrastructure expansion (Slide 25).
Crestwood Investor Presentation: A Deep Dive into Midstream Infrastructure
The Crestwood investor presentation from November 2018 is a highly technical, data-heavy deck that reflects the capital-intensive nature of the energy infrastructure sector. Unlike early-stage technology decks that sell a vision of a disrupted future, Crestwood sells the reality of physical assets, regional monopolies, and cash flow stability. The deck is structured to provide institutional investors with granular detail on basin-level performance and corporate-level financial guidance.
Slide 1: Title Slide
The presentation opens with a clean, corporate title slide. The tagline "Connections for America’s Energy" immediately establishes the company's position in the midstream sector—the bridge between upstream production and downstream consumption. The date, November 2018, sets the context for the fiscal year-end projections that follow.
Slide 5: YTD 2018 Results and Outlook
This slide serves as the executive summary. It breaks down the company's value proposition into three pillars: Strong Financial Results, Best-in-class Operations, and Fully Integrated Assets. Key data points include a Q3 Adjusted EBITDA of $101 million, which was 5% above the previous year's quarter. The slide also notes a significant operational win: a 14% reduction in O&M and G&A expenses. This demonstrates to investors that management is focused on margin expansion through efficiency, not just volume growth. The mention of a #1 ranking for Service & Professionalism by EnergyPoint adds a layer of third-party validation to their operational claims.
Slide 9: Volume Growth Drives Investments and Returns
Slide 9 is perhaps the most critical slide for justifying the company's capital expenditure. It provides volume forecasts across six key categories. The most striking figure is the projected 240% growth in Bakken water volumes from 2017 to 2019. In the shale industry, managing produced water is a massive logistical challenge and a high-margin opportunity for midstream providers. By showing consistent upward slopes in Bakken Oil (+65%), Bakken Natural Gas (+60%), and Delaware Basin (+110%), Crestwood builds a quantitative case for why their infrastructure is essential. Conversely, they show honesty by including the 5-10% annual declines in the SW Marcellus and Barnett basins, indicating a transparent reporting style.
Slide 13: Organic Growth Projects
This is a transition slide featuring high-resolution photography of pipeline construction. It serves to remind investors that the company's growth is tied to physical, 'in-the-ground' assets. The term 'Organic Growth' is strategic here; it signals that the company is growing by expanding its own footprint rather than relying solely on expensive acquisitions.
Slide 17: Bakken’s Full-Service Business Model
This slide illustrates the 'moat' Crestwood has built in the Bakken shale. It maps out a three-step integrated solution: 1. Wellhead Services (Gathering & Processing), 2. COLT Hub and Trucking (Storage and Rail), and 3. Premium Downstream Connectivity (Agreements with ONEOK, Energy Transfer, and Northern Border Pipeline). By controlling these three stages, Crestwood ensures 'flow assurance' for producers. The slide explicitly states that their #1 goal is to 'optimize producer netbacks,' aligning their success directly with the profitability of their customers.
Slide 21: PRB Economics Attracting High-Quality Producers
In the midstream business, you are only as good as your customers. Slide 21 focuses on the Powder River Basin (PRB) and features the logos of major producers like EOG Resources, Devon, and Chesapeake Energy. The slide highlights that drilling in the Turner formation offers >100% Rates of Return (RORs) at current pricing. By including direct quotes from the earnings calls of Anadarko and Devon Energy, Crestwood uses the voices of industry leaders to validate the value of the land where Crestwood owns the pipes. This is a sophisticated form of social proof that is highly effective in B2B and infrastructure fundraising.
Slide 25: 2018E Financial Outlook
This is the 'money slide.' It provides a detailed breakdown of the revised 2018 guidance. Adjusted EBITDA is projected at $400 million to $420 million, and Growth Capital is set at $300 million to $350 million. The slide also details the 'Segment Outlook,' showing that the Gathering & Processing division is the primary engine, contributing $345M-$355M to the EBITDA. The mention of divesting US Salt for $225 million at an 11x cash flow multiple is a key detail, showing that management is active in recycling capital from non-core assets into high-growth shale infrastructure.
Slide 32: Appendix
The final slide shown is a simple appendix divider with a photo of a processing plant. While the content of the appendix isn't provided in the selection, its presence in a 32-slide deck suggests a high level of transparency, likely containing GAAP reconciliations and detailed basin maps.
What Crestwood Does Well
Crestwood excels at Basin-Level Granularity . They don't just say they are growing; they show exactly which fluids (oil, gas, or water) are moving through which pipes in which geographic regions. This level of detail is mandatory for energy investors who need to model the underlying commodity risk.
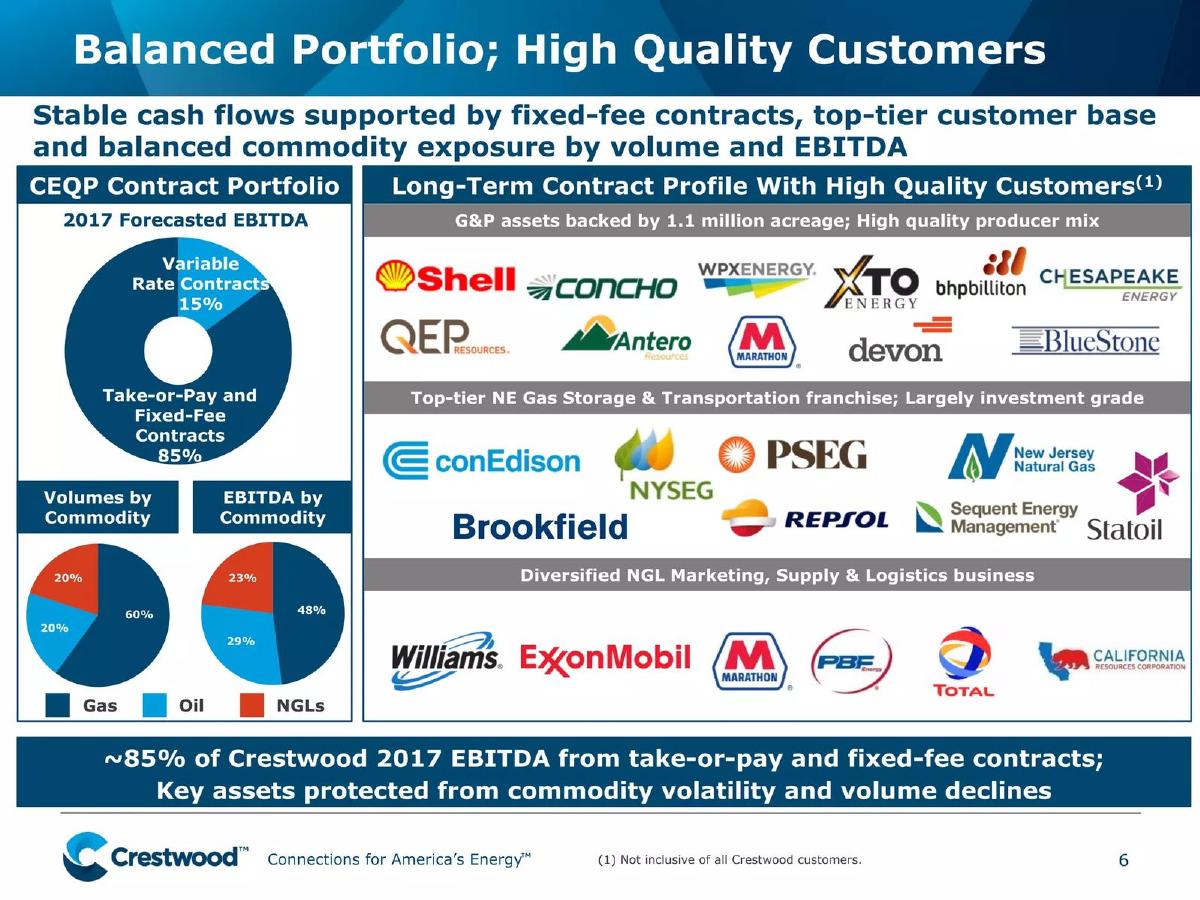
The deck also does a masterful job of Customer Alignment . By focusing on 'producer netbacks' and 'third-party operator economics,' Crestwood proves that their business model is symbiotic with the drillers. They aren't just a service provider; they are a partner in the producer's profitability.
What is Missing from the Deck
From a traditional startup perspective, the most glaring omission is a Team Slide . While this is common for established public companies where the CEO and CFO are well-known, for a private company raising funds, the lack of biographical data on the operators would be a red flag.
Additionally, there is no Competitive Landscape slide. The deck assumes the investor understands the regional monopolies inherent in midstream assets. However, a slide showing Crestwood's market share versus competitors like Enterprise Products Partners or Kinder Morgan would have provided helpful context for the company's relative scale.
Lessons for Founders
Quantify the Ecosystem: If your success depends on the success of your customers, show their economics. Crestwood’s use of producer RORs is a brilliant way to prove market demand. · Transparency in Decline: By showing the decline in the Marcellus and Barnett basins (Slide 9), Crestwood gains credibility. Founders should not be afraid to show where the business is shrinking if they can show where it is growing faster. · Use Integrated Logic: If you offer multiple services, show how they connect. Slide 17’s three-step flow chart is a perfect template for explaining a complex value chain simply. · Financial Ratios Matter: For capital-intensive businesses, showing a 'Leverage Ratio' and 'Coverage Ratio' is more important than just showing 'Revenue.' It proves you can handle the debt required to build the infrastructure.
Frequently asked questions
- What is the primary financial metric Crestwood uses to signal health?
- Crestwood focuses heavily on Adjusted EBITDA and Distributable Cash Flow. On Slide 25, they provide a revised 2018 guidance of $400M-$420M for Adjusted EBITDA and $195M-$225M for Distributable Cash Flow. They also emphasize the Distribution Coverage Ratio (>1.2x), which is a critical metric for Master Limited Partnerships (MLPs) or infrastructure firms to prove they can sustain payouts to investors while funding growth.
- How does Crestwood demonstrate market demand for its services?
- Instead of user surveys, Crestwood uses 'Volume Forecasts by Key Basin' (Slide 9). By showing projected growth in Oil (+65%), Natural Gas (+60%), and Water (+240%) in the Bakken region, they prove that their infrastructure (pipelines and processing plants) will have high utilization rates. They also include quotes from major producers like EOG Resources and Chesapeake Energy to validate the quality of the acreage they serve.
- What is the significance of the 'integrated asset strategy' mentioned in the deck?
- On Slide 17, Crestwood outlines its 'Full-Service Business Model.' This integration means they don't just provide one service; they handle wellhead gathering, processing, storage, trucking, and downstream connectivity. For an investor, this represents 'flow assurance' and multiple revenue capture points along the value chain, making the company more resilient than a single-service provider.
- Why does the deck include a slide on third-party economics?
- Slide 21, 'PRB Economics Attracting High-Quality Producers,' is a form of indirect validation. By showing that drillers in the Powder River Basin (PRB) are seeing >100% Returns on Investment (RORs), Crestwood proves that its customers are profitable and likely to continue drilling. If the producers stop drilling, Crestwood’s pipes go empty; therefore, the customers' unit economics are just as important as Crestwood's own.
- What information is missing from this deck compared to a typical startup pitch?
- The deck lacks a 'Team' slide, a 'Problem' slide, and a specific 'Ask' or 'Use of Funds' for a new round of financing. This is because Crestwood is likely a publicly traded or late-stage entity providing a quarterly update. The 'Growth Capital' figure of $300M-$350M (Slide 25) serves as the proxy for where money is being spent, but it is presented as a budget rather than a request for new capital.