Crestwood Equity Partners’ May 2018 deck is a dense, data-heavy presentation typical of the Master Limited Partnership (MLP) sector. It prioritizes financial discipline, contract stability, and organic growth projects over the visionary storytelling common in tech decks. With 86% of its 2018 forecasted EBITDA coming from take-or-pay and fixed-fee contracts, the company emphasizes risk mitigation and cash flow predictability. The presentation successfully balances high-level strategic goals, such as a 4.0x leverage target, with granular project-level details like the Bear Den processing plant…
Key takeaways
- The company highlights a massive shift toward stability, with 86% of 2018 forecasted EBITDA derived from take-or-pay and fixed-fee contracts (Slide 7).
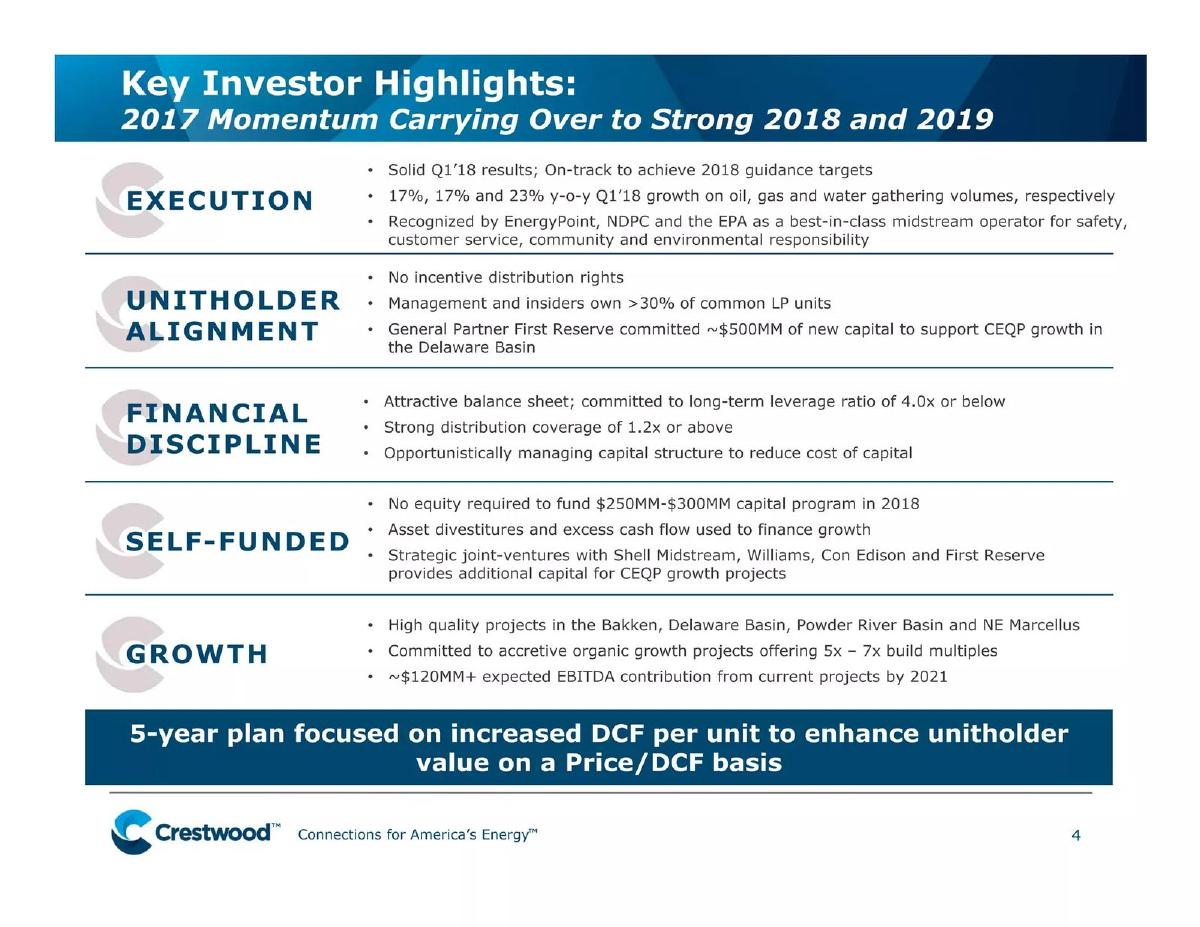
- Management and insiders maintain significant skin in the game, owning over 30% of common LP units (Slide 4).
- Crestwood emphasizes a self-funded model, stating no equity was required to fund its $250MM–$300MM capital program in 2018 (Slide 4).
- The deck provides specific operational growth targets, such as the Bear Den Phase 2 plant scheduled for Q3 2019 to reach 150 MMcf/d capacity (Slide 13).
- Financial discipline is centered on a long-term leverage ratio target of 4.0x or below, down from a 4.8x high in 2015 (Slide 22).
- The portfolio is diversified across commodities, with EBITDA split 50% Gas, 30% Oil, and 20% NGLs (Slide 7).
- A strategic 50/50 joint venture with Williams in the Powder River Basin targets an 80% increase in production exit rates for Chesapeake Energy (Slide 16).
- The deck concludes with a rigorous Non-GAAP reconciliation, projecting 2018 Distributable Cash Flow (DCF) between $195MM and $225MM (Slide 28).
Introduction: The Industrial Logic of Midstream Investing
The Crestwood Equity Partners (CEQP) investor presentation from May 2018 is a quintessential example of an energy infrastructure pitch. Unlike the speculative nature of early-stage venture decks, this presentation is built on the pillars of predictability, contract structure, and capital discipline . As a Master Limited Partnership (MLP), Crestwood’s goal is to convince investors that their infrastructure—pipelines, processing plants, and storage—is a 'toll booth' for the American energy industry.
Slide 1: Title and Branding
The cover slide is minimalist, featuring the Crestwood logo and the tagline 'Connections for America’s Energy.' It establishes the company’s identity as a midstream provider—the link between production (upstream) and consumption (downstream). The date, May 2018, is crucial as it sets the context for the post-2014 energy downturn recovery period.
Slide 4: Key Investor Highlights
This is the 'Executive Summary' slide. It breaks down the value proposition into five categories: Execution, Unitholder Alignment, Financial Discipline, Self-Funded, and Growth. Notable figures include the >30% insider ownership of common LP units, which suggests management's interests are aligned with investors. The slide also mentions a $500MM capital commitment from General Partner First Reserve for the Delaware Basin, signaling strong institutional backing. The bottom banner emphasizes the 5-year plan to increase Distributable Cash Flow (DCF) per unit, the primary metric for MLP valuation.
Slide 7: Balanced Portfolio and High-Quality Customers
This slide is designed to de-risk the investment. It features a donut chart showing that 86% of 2018 Forecasted EBITDA comes from 'Take-or-Pay and Fixed-Fee Contracts.' This is a critical defensive metric; it tells investors that even if commodity prices swing wildly, Crestwood’s revenue remains largely insulated. The slide also displays logos of major customers like Shell, ExxonMobil, and ConEd, leveraging their creditworthiness to bolster Crestwood’s own perceived stability. The commodity mix is also balanced: 50% Gas, 30% Oil, and 20% NGLs.
Slide 12: Attractive Set of Near-term Organic Growth Projects
This is a transition slide featuring a high-resolution photo of a pipeline being laid. It serves to ground the financial data in physical reality. In industrial decks, these 'boots on the ground' images are used to remind investors that the company owns hard assets with high barriers to entry.
Slide 13: Bear Den Processing Plants
Slide 13 provides a deep dive into a specific growth engine. It outlines the strategy for the Arrow gas volumes, moving from Phase 1 (30 MMcf/d) to Phase 2 (120 MMcf/d). The bar chart shows a clear Processing Capacity Growth Timeline , projecting a significant increase in CEQP-owned capacity through 2021. The mention of 'sub-6x' project returns is a specific efficiency metric that infrastructure investors use to judge capital allocation.
Slide 16: Powder River Basin Growth Strategy
This slide focuses on a strategic 50/50 joint venture (JV) with Williams. It highlights a 20-year contract with Chesapeake Energy and an inventory of 2,780 undrilled wells across 388,000 dedicated acres. The inclusion of a map and production exit rate projections (>30 Mboe/d) provides the granular detail necessary for analysts to model future throughput. It demonstrates that Crestwood isn't just maintaining assets but is positioned in high-activity basins.
Slide 21: Balance Sheet Strength and Accretive Growth
Another transition slide, this time showing a well pad. It introduces the final section of the deck: the hard financials. The focus here is on 'Disciplined Capital Allocation,' a buzzword in the 2018 energy sector meant to signal the end of the 'growth at any cost' era.
Slide 22: Strong Balance Sheet and Liquidity
This is perhaps the most important slide for institutional credit and equity analysts. It shows a Total Debt reduction from $2,544 million in 2015 to $1,499 million in Q1 2018. The Total Leverage Ratio improvement from 4.8x to 3.9x is a clear success story. Furthermore, the 'No Near-Term Debt Maturities' chart shows that the company has no significant repayments due until 2023, which reduces liquidity risk significantly.
Slide 25: Crestwood’s Industry Recognition in 2017
This slide serves as social proof. It highlights rankings from EnergyPoint Research and Wells Fargo, as well as environmental recognition from the EPA (SmartWay). In an era of increasing ESG (Environmental, Social, and Governance) scrutiny, showing 'Environmental Stewardship' alongside 'Unitholder Alignment' is a strategic move to appeal to a broader range of institutional funds.
Slide 28: CEQP Non-GAAP Reconciliations
The final slide is a technical table reconciling Net Income to Adjusted EBITDA and Distributable Cash Flow. It projects a 2018 DCF range of $195 - $225 million . This level of transparency is mandatory for public or late-stage private companies. It shows exactly how management arrives at the numbers they use to justify distributions, stripping out non-cash items like depreciation and unit-based compensation.
What Crestwood Does Well
The deck is exceptionally transparent regarding its contractual protections . By explicitly stating that 86% of EBITDA is fixed-fee or take-or-pay, they eliminate the biggest fear in energy investing: commodity price exposure. The use of specific project timelines (Slide 13) and joint venture details (Slide 16) provides a clear roadmap for how the company will reach its 2021 targets. The financial section (Slide 22) is also a highlight, showing a multi-year trend of deleveraging that builds trust with the audience.
What Is Missing From the Deck
While the deck is strong on financials and operations, it lacks a dedicated Management Team slide in this 10-slide sample (though it may exist in the full 28-slide version). For an MLP, the track record of the GP (General Partner) and the executive team is vital. Additionally, there is very little competitive analysis . The deck assumes the investor already understands the midstream landscape and doesn't explicitly explain why Crestwood’s assets are superior to those of competitors like Enterprise Products or Magellan. Finally, there is no mention of unit economics at the micro-level—such as the cost per mile of pipe laid—which would further bolster the 'Execution' claim.
What Other Founders Should Copy
Founders in capital-intensive industries (infrastructure, manufacturing, hardware) should emulate Crestwood’s 'Self-Funded' narrative . Showing that you can grow without constant trips to the equity markets is a powerful signal of a sustainable business model. Additionally, the Non-GAAP reconciliation on Slide 28 is a best practice for any company with complex accounting; it shows you have nothing to hide and understand your own cash flow drivers. Finally, the use of social proof logos (Slide 7 and 25) is effectively deployed here—not just for marketing, but to prove the quality of the revenue stream and the company’s standing in the industry.
Frequently asked questions
- What is the primary financial metric Crestwood uses to attract investors?
- Crestwood focuses heavily on Distributable Cash Flow (DCF) per unit. Unlike tech startups that focus on GMV or ARR, midstream MLPs like Crestwood use DCF to demonstrate their ability to pay out distributions to unitholders. Slide 4 explicitly states their 5-year plan is focused on increasing DCF per unit to enhance value on a Price/DCF basis.
- How does Crestwood mitigate the volatility of oil and gas prices?
- The company uses a contract-heavy strategy. According to Slide 7, 86% of their 2018 forecasted EBITDA is protected by take-or-pay and fixed-fee contracts. This means they get paid based on the volume capacity reserved or moved through their pipes, regardless of the actual market price of the underlying commodity.
- What is the significance of the 'Self-Funded' claim in the deck?
- In the MLP world, companies historically relied on constantly issuing new equity to fund growth, which diluted existing investors. Crestwood’s claim on Slide 4 that they required 'no equity' to fund their $250MM-$300MM capital program is a signal of financial maturity and a shift toward using internal cash flow and asset divestitures for growth.
- Who are Crestwood's primary customers?
- Slide 7 showcases a 'blue-chip' customer base including Shell, ExxonMobil, ConEd, and Chesapeake Energy. By listing these investment-grade and large-cap producers, Crestwood signals to investors that their counterparty risk—the danger of a customer going bankrupt and failing to pay—is relatively low.
- How does the deck address debt and leverage?
- Slide 22 is dedicated to 'Balance Sheet Strength.' It shows a clear downward trend in leverage from 4.8x in 2015 to 3.9x in Q1 2018. It also highlights that they have no near-term debt maturities, with the next major notes not due until 2023, providing a long runway for their organic growth projects to come online.