Semperit Group's November 2016 investor presentation serves as a comprehensive update for a mature, publicly-traded industrial entity. The deck segments the business into four main brands: Semperflex, Sempertrans, Semperform, and Sempermed. While the Industrial sector showed resilience with a 14.7% EBIT margin in Q1-3 2016, the Medical sector (Sempermed) faced a severe 'margin squeeze,' resulting in a -49.6% EBITDA decline. The presentation balances long-term megatrends, such as population growth and infrastructure investment, against immediate operational challenges like currency risks and c…
Key takeaways
- The company identifies three global megatrends driving growth: population growth to 9.6 billion by 2050, 66% urbanisation, and a 30% increase in energy demand by 2035 (Slide 5).
- Semperit holds dominant market positions, including #3 globally in hydraulic hoses and a leading global position in examination gloves (Slide 5).
- Revenue is heavily concentrated in Europe, accounting for 74% of Industrial Sector revenue and 55% of Medical Sector revenue in FY 2015 (Slide 9).
- The Medical Sector (Sempermed) experienced a significant downturn in Q1-3 2016, with revenue dropping 12.9% and EBITDA falling 49.6% due to margin pressure (Slide 13).
- Industrial Sector EBIT margins remained strong at 14.7% for Q1-3 2016, despite a slight decline from 16.1% in the prior year (Slide 17).
- The 2016 outlook projected a 10% decline in EBITDA and a 20% decline in EBIT due to challenging market conditions and currency risks (Slide 21).
- Group-wide earnings after tax fell by 41.6% to EUR 23.4m in the first three quarters of 2016 compared to the same period in 2015 (Slide 25).
- The balance sheet remains stable with total assets of EUR 969m and a net debt to EBITDA ratio of 2.32x as of September 30, 2016 (Slide 29).
Semperit Group: A Deep Dive into Industrial and Medical Rubber Manufacturing
The Semperit Group investor presentation from November 2016 provides a transparent, data-heavy look at a company navigating the complexities of global manufacturing. As a mature player in the rubber and plastics industry, Semperit uses this deck to communicate both its long-term strategic advantages and its short-term operational hurdles. The presentation is structured to show how global megatrends support the business model, while financial slides provide a granular view of the performance divergence between its Industrial and Medical sectors.
Slide 1: Title and Branding
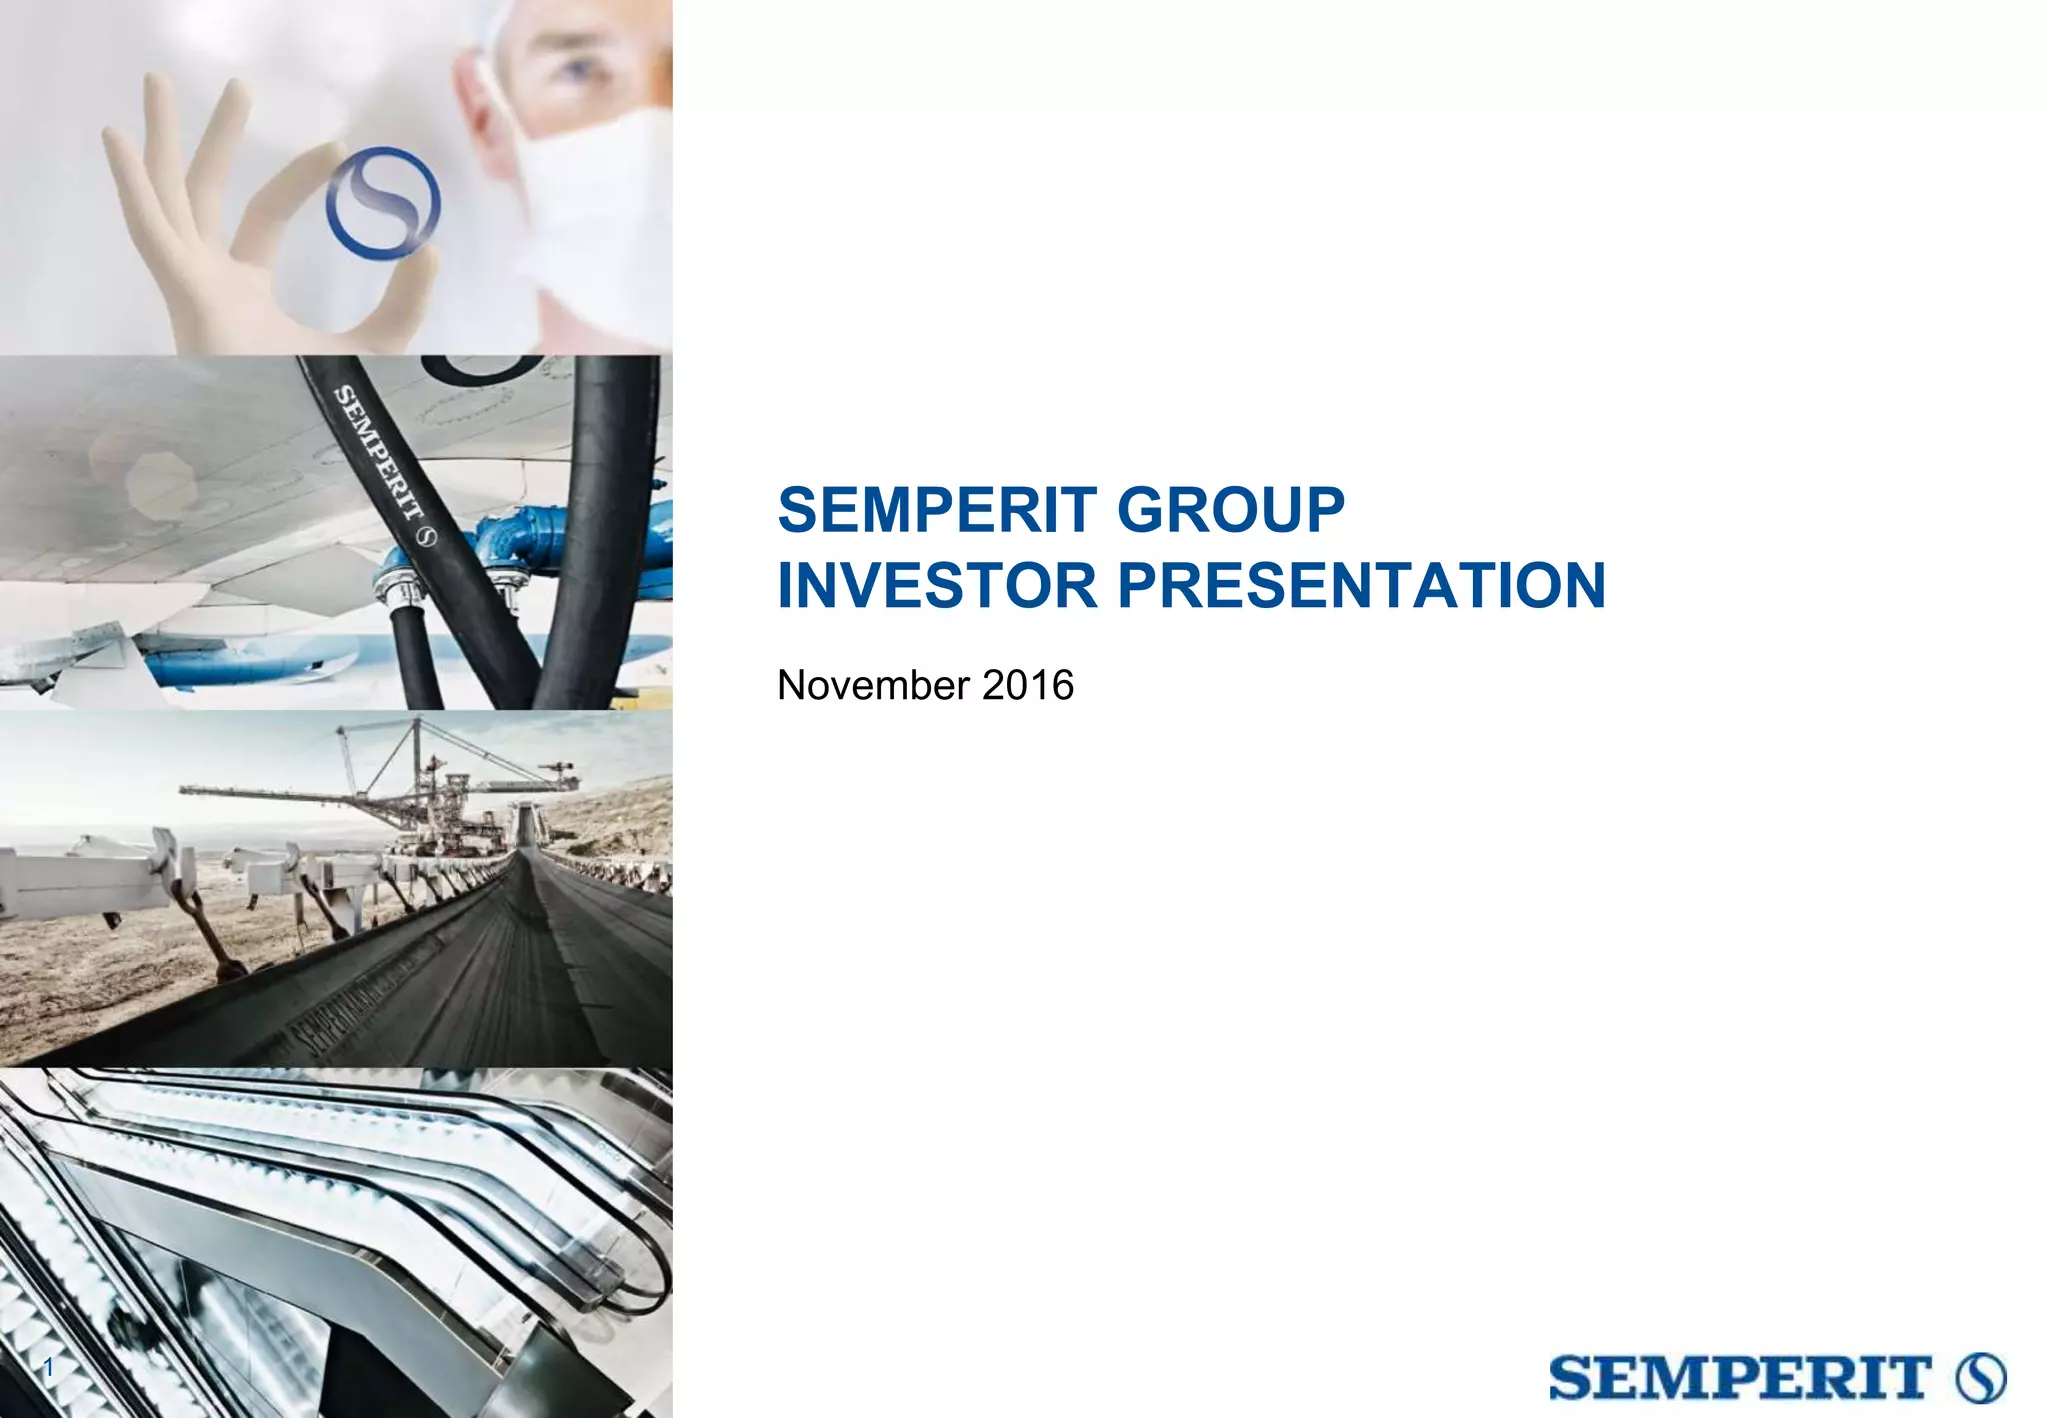
The cover slide establishes the corporate identity of Semperit Group. It features four distinct images representing the company's core product lines: medical gloves, industrial hoses, conveyor belts, and escalator handrails. The branding is clean and professional, clearly stating the date as November 2016. This slide sets the stage for a diversified industrial narrative.
Slide 5: Market Positioning and Megatrends
This slide serves as the strategic foundation of the deck. Semperit links its business units to three 'Global megatrends': population growth (+33% to 9.6 billion by 2050), worldwide urbanisation (66% urban population by 2050), and worldwide energy demand (+30% by 2035). Slide 5 also details the market positions of its four brands:
Semperflex: #3 globally in hydraulic hoses; #2-3 in Europe for industrial hoses. · Sempertrans: Top Tier worldwide supplier of conveyor belts. · Semperform: Leading position in handrails and ski foils; European player in window profiles. · Sempermed: Globally leading position in examination gloves; leading position in Europe for surgical gloves.
The slide includes a chart showing the global construction market growing from USD 8.4 trillion in 2015 to USD 15.5 trillion in 2030, an 85% increase, which directly supports the Industrial Sector's growth thesis.
Slide 9: Geographic Revenue Diversification
Slide 9 breaks down revenue by region for the 2015 fiscal year. The data reveals a heavy reliance on the European market, which accounts for 74% of Industrial Sector revenue and 55% of Medical Sector revenue. North and South America contribute 11% to Industrial and 35% to Medical. The slide emphasizes a 'globally diversified sales network,' though the charts suggest that growth in Asia and the Americas remains a significant opportunity for further diversification, as Asia and Africa currently represent only 15% and 10% of the two sectors, respectively.
Slide 13: Segment Performance Comparison
This slide provides a stark contrast between the Semperform and Sempermed units for Q1-3 2016 versus Q1-3 2015. Slide 13 reports that Semperform saw a 3.4% increase in revenue despite a 2% market decline, indicating market share gains. Conversely, Sempermed suffered a 12.9% revenue decline and a massive 49.6% drop in EBITDA. The company attributes this to a 'margin squeeze' in the global glove market and start-up costs in Malaysia. This slide is crucial for investor honesty, as it does not hide the significant earnings pressure in the medical segment.
Slide 17: EBIT Margin Analysis
Slide 17 uses a bridge chart to show the transition of EBIT from Q1-3 2015 to Q1-3 2016. The Group EBIT fell from EUR 53.9m to EUR 46.7m, a 13.5% decrease. The chart highlights that the Industrial Sector maintained a strong EBIT margin of 14.7%, with Semperflex leading at 19.9%. However, the Medical Sector (Sempermed) dragged down the group with a -0.3% EBIT margin. This visualization helps investors understand exactly where the value is being created and where it is being eroded within the portfolio.
Slide 21: 2016 Outlook and Growth Targets
The outlook slide is characterized by realism. Slide 21 warns that operational results for the full year 2016 are expected to be below the prior year, with EBITDA down about 10% and EBIT down about 20%. It cites 'challenging market conditions' and 'uncertain outlook for commodity prices.' Despite these headwinds, the company maintains a long-term growth target of 'average double-digit volume growth 2015-2020 (CAGR).' This slide balances immediate negative guidance with a commitment to long-term expansion.
Slide 25: Consolidated Financial Overview
Slide 25 provides the most comprehensive data table in the deck, comparing Q1-3 2016 to the restated Q1-3 2015 figures. Key metrics include:
Group Revenue: EUR 647.6m (down 6.4%). · Group EBITDA: EUR 72.2m (down 4.2%). · Earnings After Tax: EUR 23.4m (down 41.6%). · Earnings Per Share: EUR 1.14 (down from EUR 1.95). · Employees: 7,028 (down 3.8%).
The table also shows that while investments in the Industrial sector decreased by 7.4%, investments in the Medical sector decreased by 22.1%, reflecting a tightening of capital expenditure in the face of lower margins.
Slide 29: Balance Sheet and Liquidity
To reassure investors of the company's stability, Slide 29 focuses on the balance sheet as of September 30, 2016. The balance sheet total stands at EUR 969m. The company highlights a 'solid balance sheet structure' with:
Cash and cash equivalents: EUR 131m. · Net debt: EUR 216m. · Net debt / EBITDA: 2.32x. · Equity ratio: 37%.
This slide is intended to demonstrate that despite the earnings squeeze in the medical segment, the company has sufficient 'financial flexibility' to continue its investment programmes.
Slide 33: Detailed Equity and Liabilities
The final slide in this selection, Slide 33 , provides a granular breakdown of equity and liabilities in EUR thousands. It shows that total equity attributable to shareholders was EUR 358.9m as of September 30, 2016, a slight decrease from EUR 363.2m at the end of 2015. Non-current liabilities increased significantly from EUR 405.4m to EUR 454.3m, primarily driven by an increase in liabilities to banks (from EUR 162.8m to EUR 208.2m). This level of detail is typical for a public company investor relations deck, providing the raw data necessary for analysts to perform their own valuations.
What Semperit Group Does Well
Semperit excels at segment reporting. By clearly separating the Industrial and Medical sectors, the company prevents the struggles of one from completely obscuring the successes of the other. The use of bridge charts (Slide 17) and detailed comparative tables (Slide 25) provides a high level of transparency. Furthermore, the company effectively links its mundane industrial products to exciting global megatrends (Slide 5), giving investors a reason to care about the long-term trajectory of the business beyond the current quarter's earnings.
What is Missing from the Deck
While the deck is thorough regarding financial history and market positioning, it lacks a detailed competitor analysis. While it claims to be '#3 globally' or a 'leading player,' it does not name the #1 or #2 competitors or explain the specific technological advantages it holds over them. Additionally, the 'Team' slide is missing from this selection, which is standard for startup decks but also important for established firms to showcase executive leadership and succession planning. Finally, while it mentions 'efficiency, optimisation and cost cutting' (Slide 21), it does not provide a specific roadmap or dollar-value target for these savings.
What Other Founders Should Copy
Founders of industrial or hardware-heavy startups should emulate Semperit’s approach to market sizing and growth drivers. Instead of just stating a TAM (Total Addressable Market), Semperit identifies the specific 'megatrends' (Slide 5) that will force that market to grow. The use of a 'Financial Profile' slide (Slide 29) that highlights key ratios like Net Debt/EBITDA and Equity Ratio is also a best practice for companies moving toward later-stage funding or IPO, as it demonstrates a sophisticated understanding of capital structure and balance sheet health.
Frequently asked questions
- What are the primary business segments of Semperit Group?
- Semperit Group operates in two main sectors: Industrial and Medical. The Industrial sector includes Semperflex (hydraulic and industrial hoses), Sempertrans (conveyor belts), and Semperform (handrails and window profiles). The Medical sector consists of Sempermed, which produces examination and surgical gloves. According to slide 5, these segments hold top-tier global or European market positions.
- How did the company perform financially in the first three quarters of 2016?
- Financial performance was mixed but generally down. Slide 25 shows that Group revenue decreased by 6.4% to EUR 647.6m, and EBITDA fell by 4.2% to EUR 72.2m. The most significant impact was on earnings after tax, which dropped 41.6% to EUR 23.4m. This was largely driven by a sharp decline in the Medical sector's profitability.
- What factors contributed to the decline in the Medical sector?
- Slide 13 attributes the Medical sector's (Sempermed) struggles to a 'margin squeeze' affecting all producers in the global glove market. Additionally, start-up costs for new production in Malaysia and issues with a joint venture in Thailand put significant pressure on earnings, leading to a 49.6% drop in EBITDA for that segment.
- What is the company's geographic revenue distribution?
- Semperit is primarily focused on the European market. Slide 9 indicates that in FY 2015, Europe accounted for 74% of Industrial revenue and 55% of Medical revenue. North and South America represented 11% and 35% of those sectors, respectively, while Asia and Africa made up the remainder.
- What was the outlook for the remainder of 2016?
- The outlook was cautious. Slide 21 projected that full-year operational results would be below 2015 levels, with EBITDA expected to decline by approximately 10% and EBIT by 20%. The company cited 'challenging market conditions,' commodity price uncertainty, and currency risks as the primary headwinds.