The May 2011 investor presentation for Penn Virginia Corporation (PVA) serves as a case study in corporate strategic pivoting within the energy sector. At a time when natural gas prices were volatile, PVA used this deck to communicate a deliberate reallocation of capital toward oil and NGLs, increasing that allocation from just 5% in 2007 to a projected 77% in 2011 (Slide 10). The deck relies heavily on technical geological positioning in the Eagle Ford Shale and Anadarko Basin to prove future value. While it lacks a traditional 'team' slide with bios, it emphasizes institutional 'track recor…
Key takeaways
- The company executed a massive capital reallocation, moving from 5% Oil & NGLs spending in 2007 to a projected 77% in 2011 (Slide 10).
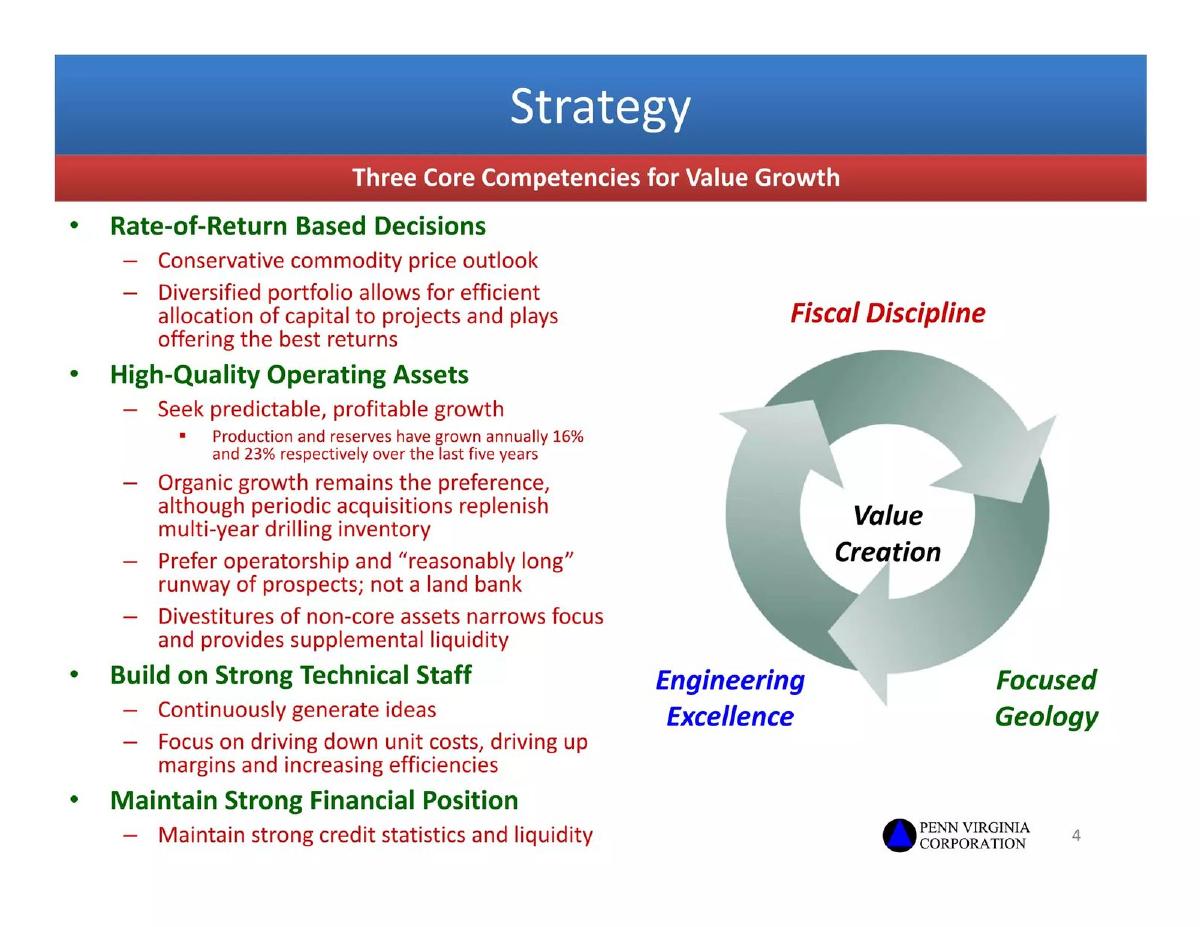
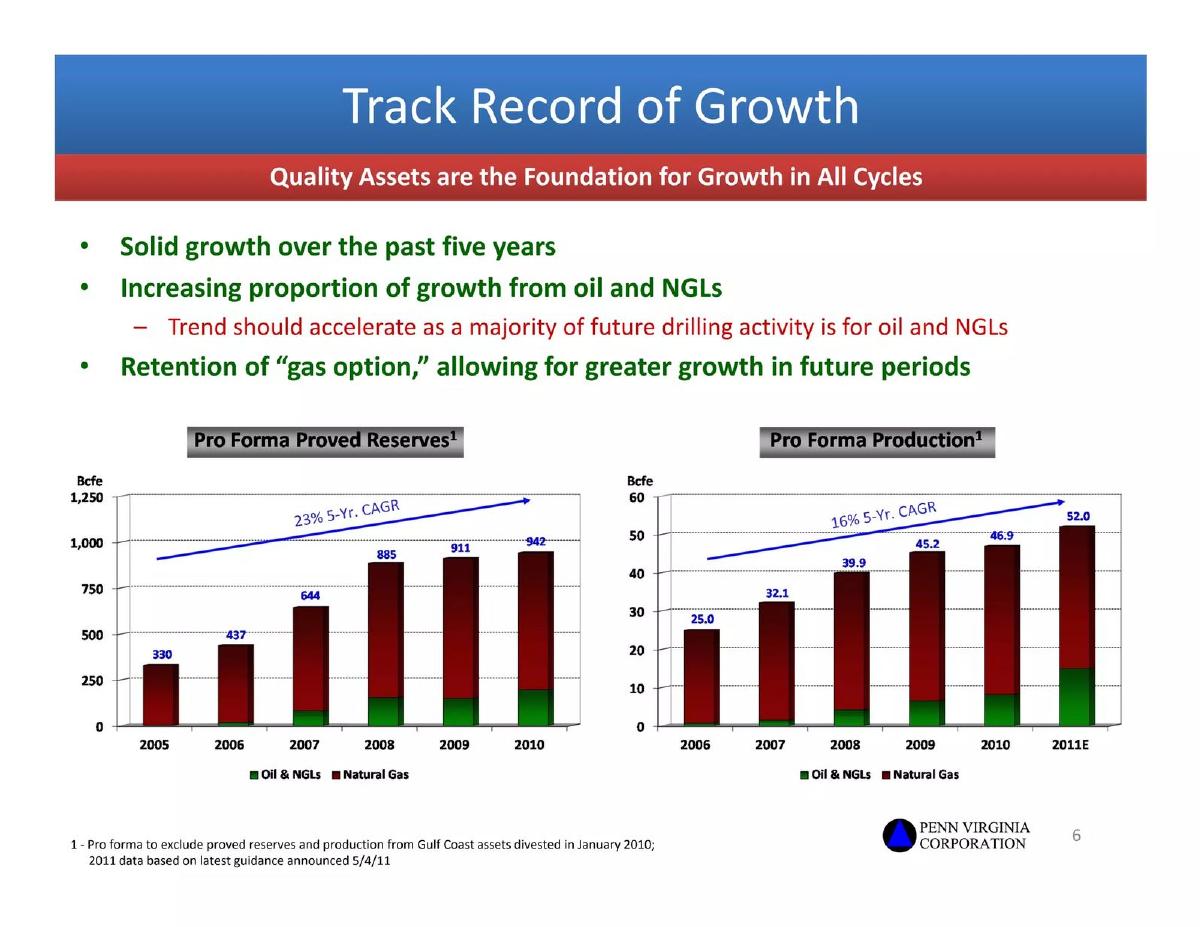
- PVA highlights a 16% annual production growth and 23% reserve growth over the five years preceding the presentation (Slide 4).
- Lease operating expenses were managed down from a peak of $1.27/Mcfe in 2008 to $1.06/Mcfe in 2010 (Slide 7).
- Strategic focus is placed on the Eagle Ford Shale, specifically 12,700 net acres in the 'Volatile Oil' window of Gonzales County (Slide 13).
- The company maintains a conservative leverage profile, showing a Net Debt/EBITDAX ratio of 3.0x for Pro Forma 1Q11 (Slide 19).
- Liquidity was bolstered by a $300MM offering of senior notes, resulting in $310MM of pro forma liquidity as of March 2011 (Slide 19).
- The deck provides full transparency on 'Adjusted EBITDAX,' reconciling a $65.3M net loss in 2010 to a positive $173.3M adjusted figure (Slide 25).
- Operational strategy emphasizes 'reasonably long' runways of prospects rather than acting as a 'land bank' (Slide 4).
Introduction
The May 2011 Investor Presentation for Penn Virginia Corporation (NYSE: PVA) is a technical, data-driven deck designed for institutional investors and analysts. At this point in the energy cycle, the industry was shifting focus from dry natural gas to liquids-rich shale plays. This deck is a textbook example of how a legacy energy company communicates a major strategic pivot to the public markets.
Slide 1: Title and Visual Context
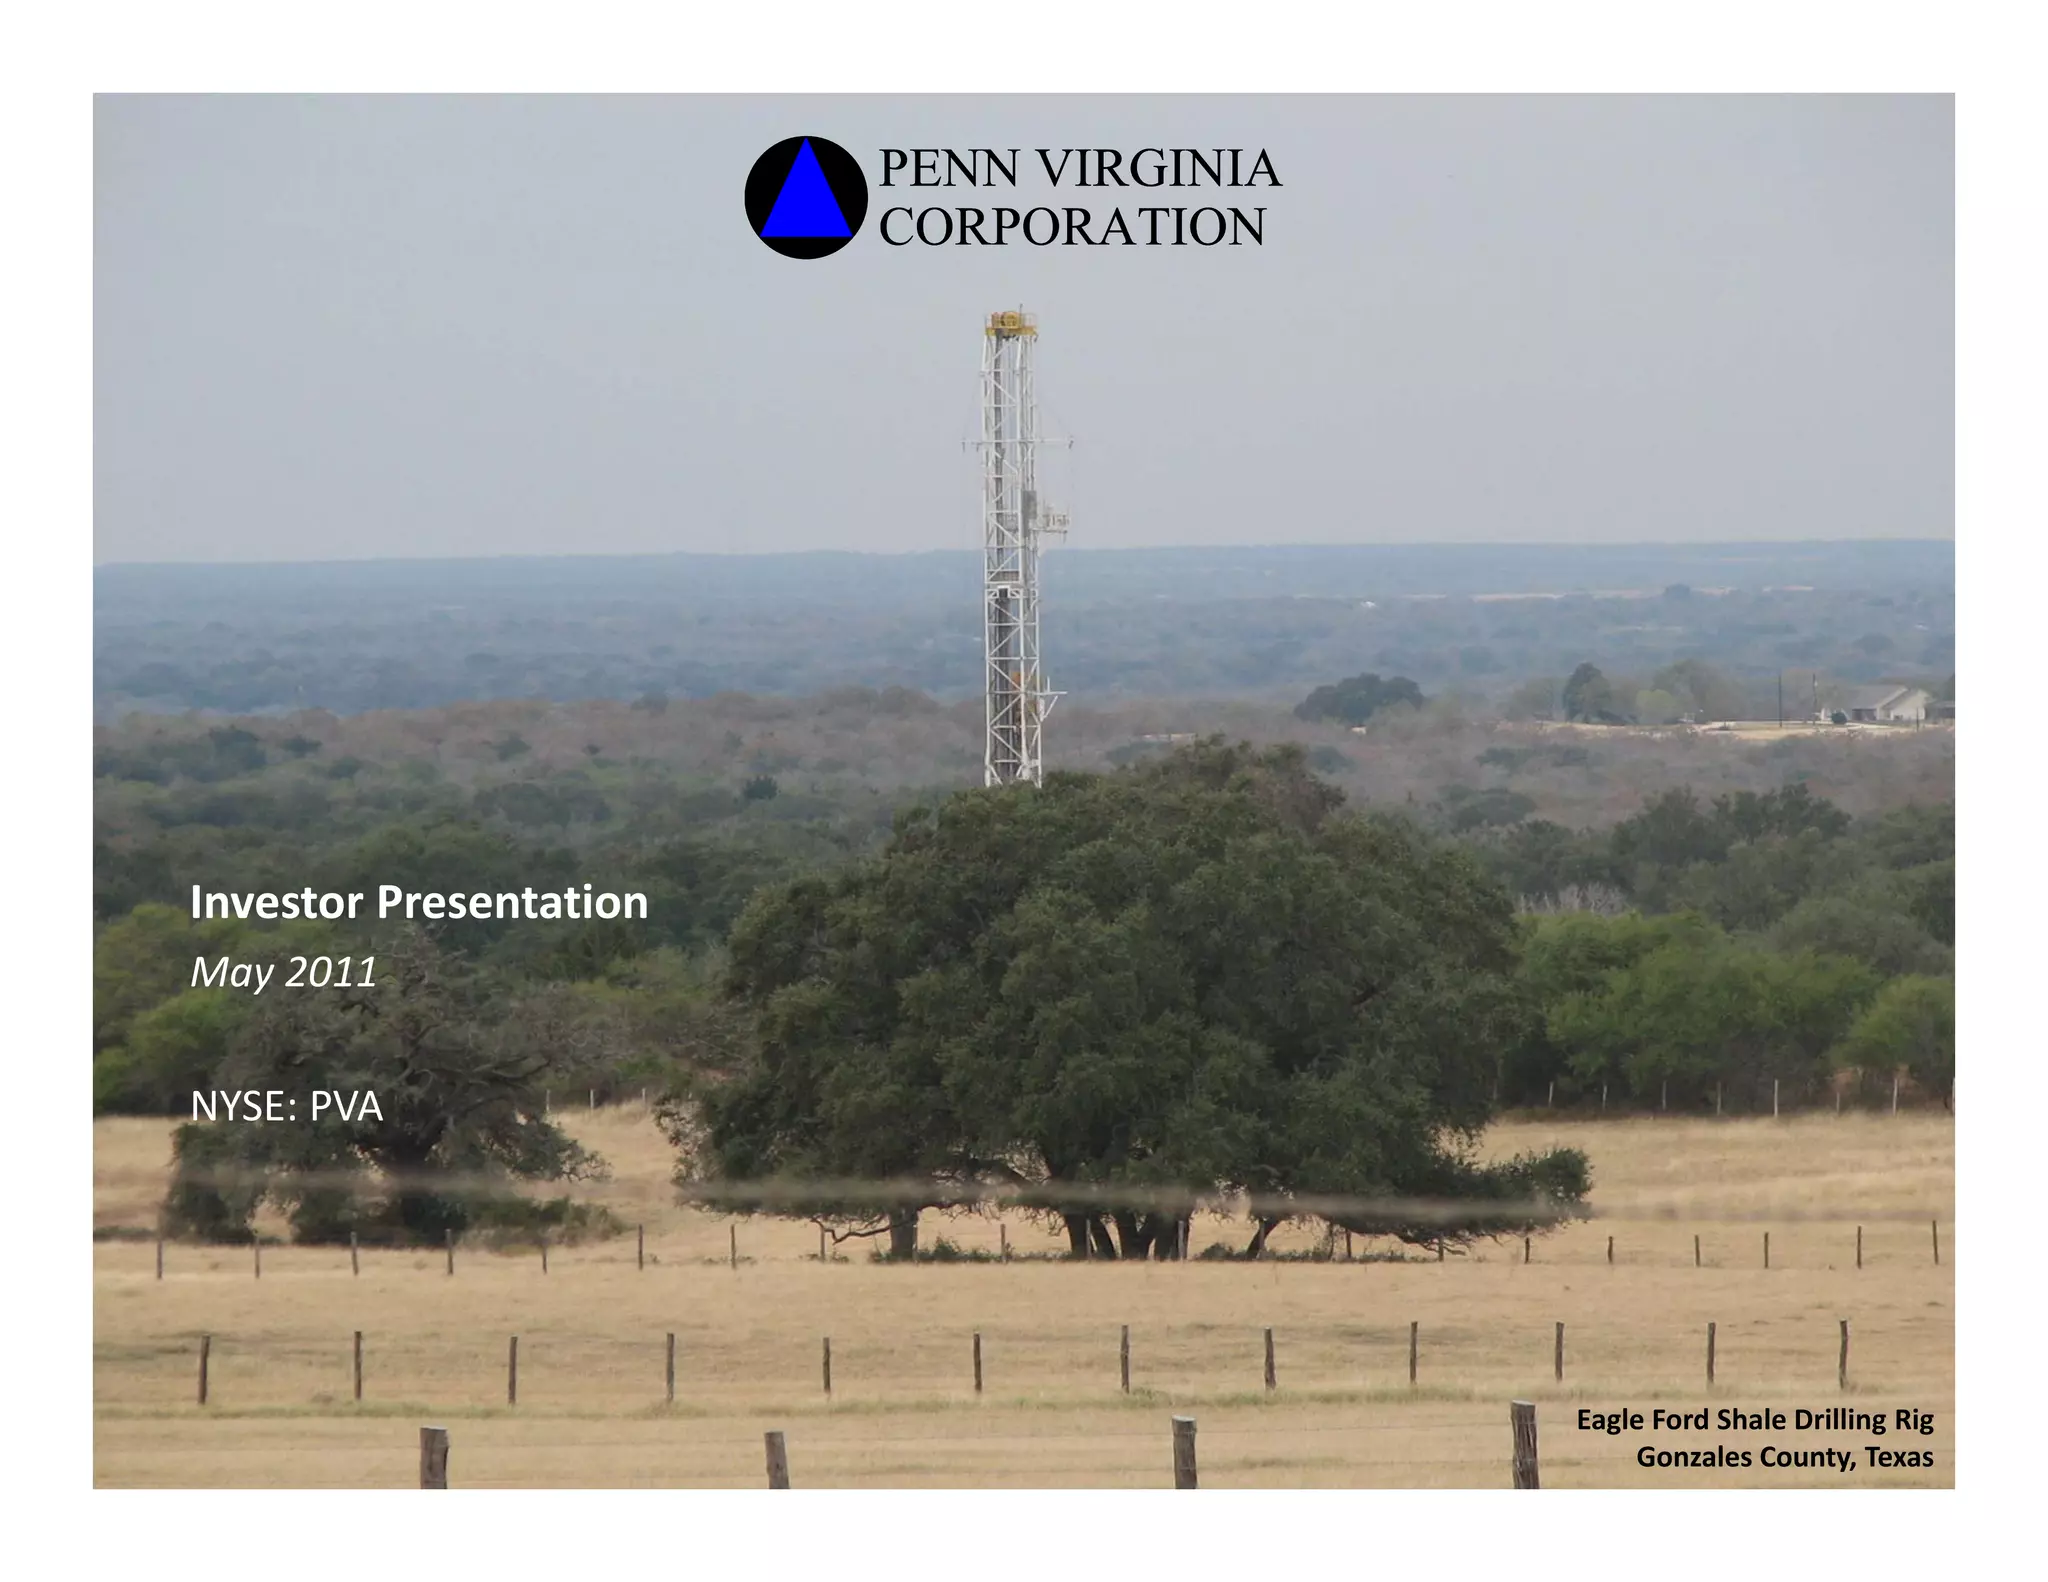
The cover slide establishes the company's identity and immediate operational focus. It features a photograph of an Eagle Ford Shale drilling rig in Gonzales County, Texas. This is not just a generic industry photo; it specifically identifies the company's primary growth asset. The inclusion of the NYSE ticker (PVA) signals that this is a presentation for a publicly traded entity, requiring a high level of regulatory and financial scrutiny.
Slide 4: Strategy and Core Competencies
This slide outlines the company's operational philosophy. It identifies three core competencies: Rate-of-Return Based Decisions, High-Quality Operating Assets, and a Strong Technical Staff. A key metric provided here is the historical growth rate: production and reserves grew annually by 16% and 23%, respectively, over the five years leading up to 2011. The slide also explicitly states a preference for 'operatorship,' meaning the company wants to control the drilling process rather than just owning a passive financial interest in the land.
Slide 7: Track Record of Value Creation
Slide 7 focuses on efficiency. It presents two primary charts. The first shows Lease Operating Expenses (LOE) per Mcfe. While expenses rose from $0.88 in 2006 to $1.27 in 2008, the company successfully brought them back down to $1.06 by 2010. The second chart is a dense benchmarking exercise, comparing PVA's reserve replacement costs against a massive peer group. By plotting their performance against the median ($2.91/Mcfe), they attempt to prove that their 'drill-bit' efficiency is superior to the broader market.
Slide 10: The Capital Reallocation Pivot
This is arguably the most important slide in the deck. It visualizes the company's shift from natural gas to oil and NGLs. In 2007, only 5% of capital expenditures were allocated to oil and NGLs. By 2010, that figure rose to 61%, with a 2011 estimate of 77%. Total CapEx is shown fluctuating, with a peak of $642MM in 2008, dropping significantly in 2009 ($172MM), and stabilizing at a projected $345MM for 2011. This slide tells the story of a company following the money into higher-margin commodities.
Slide 13: Eagle Ford Shale Activity Map
Slide 13 provides the geological 'proof' for their strategy. It maps out 12,700 net acres in Gonzales County, Texas. The map is color-coded to show different production 'windows' (Volatile Oil, Wet Gas, etc.). By placing their acreage (marked with yellow stars) directly adjacent to successful wells from peers like EOG and MHR, the company uses 'nearology' to de-risk the asset for investors. They list specific well results, such as the Gardner 1H at 1,250 BOEPD (Barrels of Oil Equivalent Per Day), to provide concrete evidence of the area's productivity.
Slide 16: Mid-Continent and Granite Wash
This slide focuses on the Anadarko Basin. It highlights a development drilling joint venture (JV) with Chesapeake Energy (CHK). Key data points include ~9,700 net acres in Washita County and ~80 drilling locations within the JV. The company notes that 48% of the reserves in this JV are liquids, further supporting the 'liquids-rich' theme of the deck. They also disclose a CAPEX budget of up to $85MM for this region in 2011.
Slide 19: Financial Position and Liquidity
For a capital-intensive industry like oil and gas, the balance sheet is as important as the geology. Slide 19 shows 'Conservative Leverage' and 'Strong Liquidity.' The Net Debt/EBITDAX ratio is shown peaking at 3.0x in the Pro Forma 1Q11. The liquidity chart shows a significant jump from $147MM in 2008 to $540MM in 2010, before settling at a pro forma $310MM following a $300MM senior notes offering. This slide is intended to reassure investors that the company has the 'dry powder' necessary to execute its drilling plan.
Slide 22: The 'Why PVA?' Summary
This is the concluding pitch. It summarizes the investment thesis into seven bullet points. It emphasizes the 'diversified portfolio,' the 'management team with a track record,' and the 'option on natural gas assets.' This last point is subtle but important: while they are pivoting to oil, they still own gas assets that could become valuable if gas prices recover, providing an 'option' for investors.
Slide 25: Non-GAAP Reconciliations
The final slide in this selection is a technical necessity for public companies. It reconciles Net Income to Adjusted EBITDAX. This is crucial because, in 2010, the company reported a net loss of $65.3MM. However, after adding back non-cash items like Depreciation, Depletion, and Amortization ($134.7MM) and Impairments ($46.0MM), the 'Adjusted EBITDAX' is a positive $173.3MM. This slide ensures that sophisticated analysts are looking at the cash-flow potential of the business rather than just the accounting bottom line.
What Penn Virginia Corp Does Well
The deck is exceptionally strong at providing contextual benchmarking . By including a peer group of over 30 companies on Slide 7, they don't just say they are good; they show where they sit in the competitive landscape. This builds significant credibility with institutional investors who track the entire sector.
Furthermore, the clarity of the strategic pivot on Slide 10 is masterful. It takes a complex corporate transition and boils it down to a single bar chart showing the percentage shift from green (oil) to red (gas). It makes the company's future direction unmistakable.
What is Missing
The most notable omission in these slides is a detailed management team slide . While Slide 4 mentions 'Strong Technical Staff' and Slide 22 mentions a 'Management team with a track record,' there are no names, bios, or faces. In a startup deck, this would be a fatal flaw. In a public company deck, it is less critical but still leaves a gap in the 'human' element of the story.
Additionally, there is a lack of environmental or regulatory risk disclosure within these specific slides. While likely covered in the full 26-slide deck or the 10-K, the absence of a 'Risk Factors' summary in the core presentation is a missed opportunity to address the growing concerns around hydraulic fracturing that were prevalent in 2011.
Founder Takeaways
Use 'Nearology' to De-risk: If you are in a location-based or sector-based business, show who your neighbors are. PVA's use of maps to show they are drilling in the same 'window' as industry giants like EOG is a powerful way to borrow credibility (Slide 13).
Visualize Your Pivot: If your company is changing direction, don't just talk about it in the prose. Create a chart that shows the 'Before' and 'After' of your resource allocation. Slide 10 is the gold standard for this.
Benchmark Aggressively: Don't be afraid of your competitors. By including them in your charts, you show that you understand the market and are confident enough to be measured against the best in your field (Slide 7).
Transparency Wins: If your 'real' numbers look different from your 'accounting' numbers, provide the bridge. The Non-GAAP reconciliation on Slide 25 is a great example of how to be honest about losses while highlighting the underlying cash strength of the business.
Frequently asked questions
- What was the primary strategic goal of this presentation?
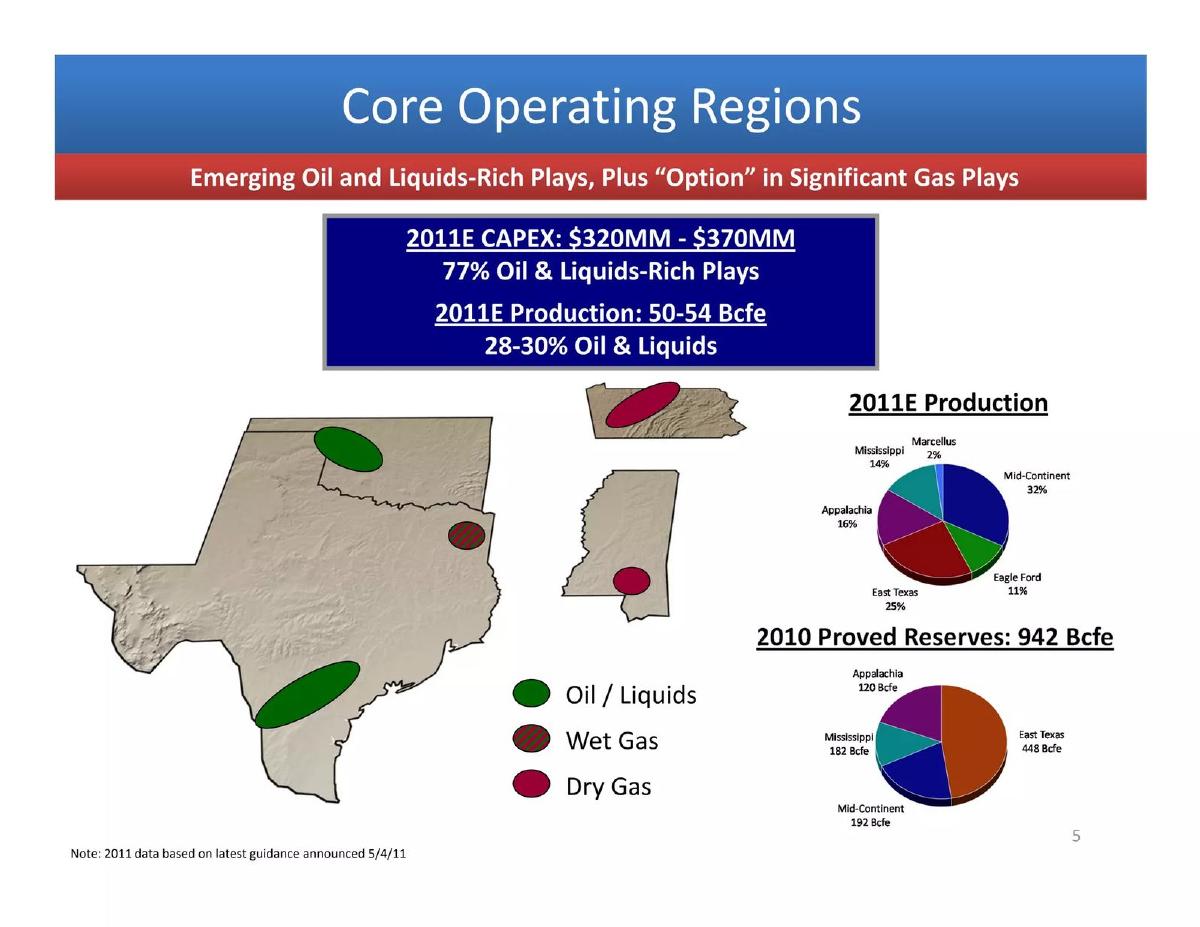
- The primary goal was to demonstrate Penn Virginia Corp's transition into a liquids-focused producer. By showing that 77% of 2011 capital expenditures were directed toward oil and NGLs (Slide 10), the company aimed to distance itself from the depressed natural gas prices of that era and highlight higher-margin opportunities in the Eagle Ford Shale and Anadarko Basin.
- How did the company justify its technical expertise?
- Instead of individual executive bios, the company focused on 'Engineering Excellence' and 'Focused Geology' as core competencies (Slide 4). They used comparative maps (Slide 13) to show their acreage was positioned directly alongside major peers like EOG and Hunt, using 'well-positioned' geography as a proxy for technical competence and potential success.
- What financial metrics did the company prioritize?
- The company prioritized EBITDAX (Earnings Before Interest, Taxes, Depreciation, Amortization, and Exploration expenses) and liquidity. Slide 19 shows a clear focus on maintaining a 'Strong Financial Position' with $310MM in pro forma liquidity, while Slide 25 provides a detailed breakdown of how they calculate Adjusted EBITDAX to account for non-cash impairments and derivative settlements.
- What specific regions were highlighted as growth drivers?
- The two main regions highlighted were the Eagle Ford Shale in South Texas and the Anadarko Basin in the Mid-Continent. Specifically, they noted 12,700 net acres in Gonzales County (Slide 13) and a joint venture with Chesapeake Energy (CHK) in the Granite Wash, covering approximately 9,700 net acres (Slide 16).
- How did the company address its historical performance?
- PVA used a 'Track Record of Value Creation' slide (Slide 7) to show they could deliver growth at low operating costs. They specifically benchmarked their reserve replacement costs against a peer group of over 30 companies, including APA, CHK, and DVN, to prove their investment efficiency was above the industry median.