CanniMed Therapeutics Inc. presents a compelling case for the industrialization of medical cannabis, moving away from 'lifestyle' branding toward a rigorous biopharmaceutical model. The deck, dated Q3 2017, showcases significant scaling milestones: an 80% increase in Q3 revenue and a 143% jump in active patients year-over-year. By emphasizing their GMP-compliant facilities in Saskatchewan and their first-mover status in international markets like Australia and the Cayman Islands, CanniMed differentiates itself through regulatory moats. The presentation effectively uses clinical-style product…
Key takeaways
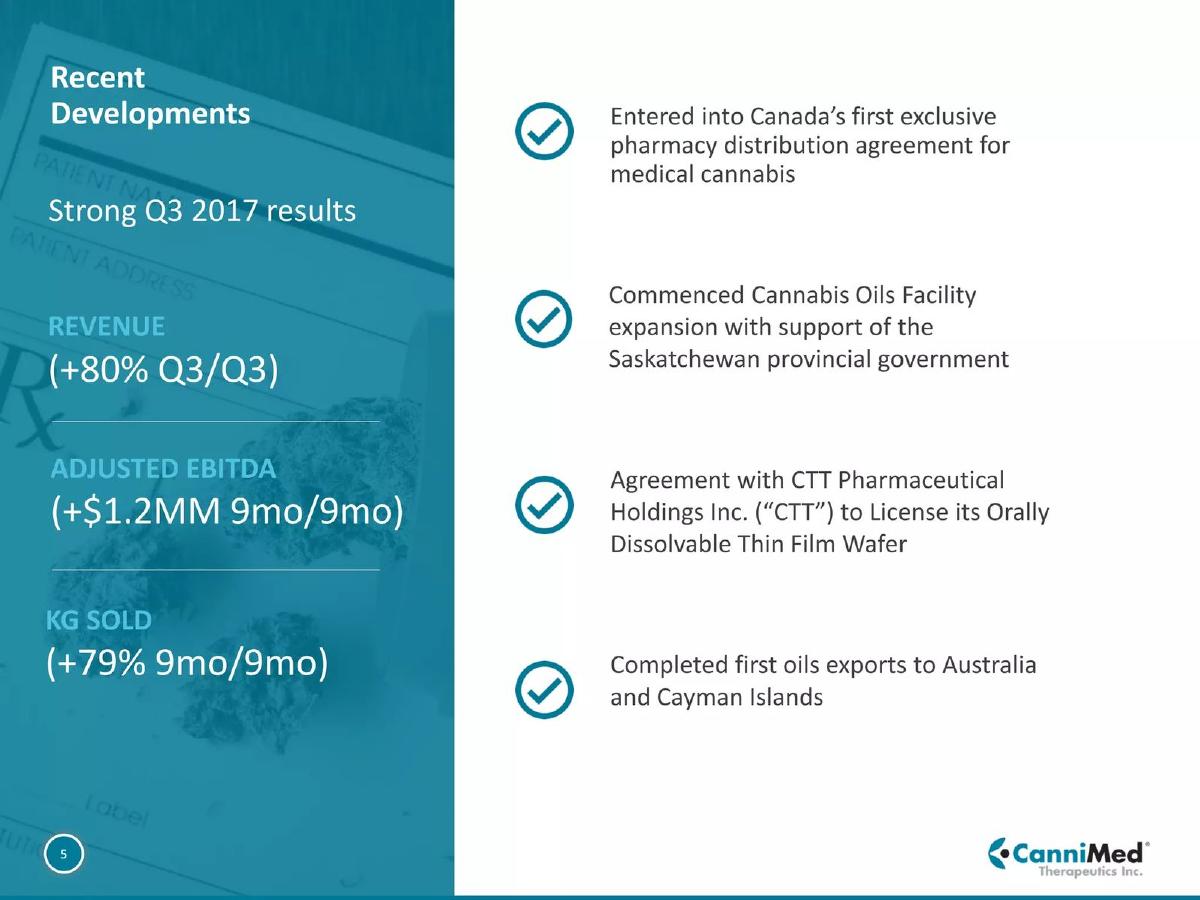
- Revenue grew by 80% year-over-year as of the Q3 2017 reporting period (Slide 5).
- Active patient counts increased by 143%, rising from 7,631 in July 2016 to 18,512 in July 2017 (Slide 15).
- The company operates a 100-acre site in Saskatoon with 30 growth chambers and a current capacity of 7,000 kg (Slide 13).
- CanniMed achieved a significant shift in product mix, with oil equivalents rising from 36% to 57% of revenue (Slide 15).
- International expansion is a core pillar, with completed exports to Australia and the Cayman Islands and an LOI for the EU market (Slide 9).
- The company maintains a strong balance sheet with $54.2 million in cash and a market capitalization of $208.9 million as of September 2017 (Slide 17).
- Product branding is strictly clinical, using color-coded labels based on specific THC and CBD percentages to build doctor confidence (Slide 11).
- The management team and board include heavy representation from pharmaceutical and financial sectors, including former Mallinckrodt and SaskTel executives (Slide 19).
Executive Summary: The Biopharmaceutical Pivot
The CanniMed Therapeutics Inc. Q3 2017 investor presentation is a masterclass in rebranding a stigmatized industry into a clinical powerhouse. By framing cannabis through the lens of pharmaceutical standards (GMP) and addressing the global opioid crisis, CanniMed moves the conversation away from cultivation and toward therapeutic outcomes. The deck serves as a progress report for a company that has successfully transitioned from early-stage operations to a high-growth, international distributor.
Slide 1: Title and Positioning
The cover slide establishes the company's identity: CanniMed Therapeutics Inc. It explicitly labels the firm as a "Leader in Canadian Medical Cannabis and International First Mover." The use of the term "Therapeutics" and the clinical blue-and-white color palette immediately signals a medical focus. The date, "Third Quarter 2017," sets the context for the performance data that follows.
Slide 3: Summary Overview
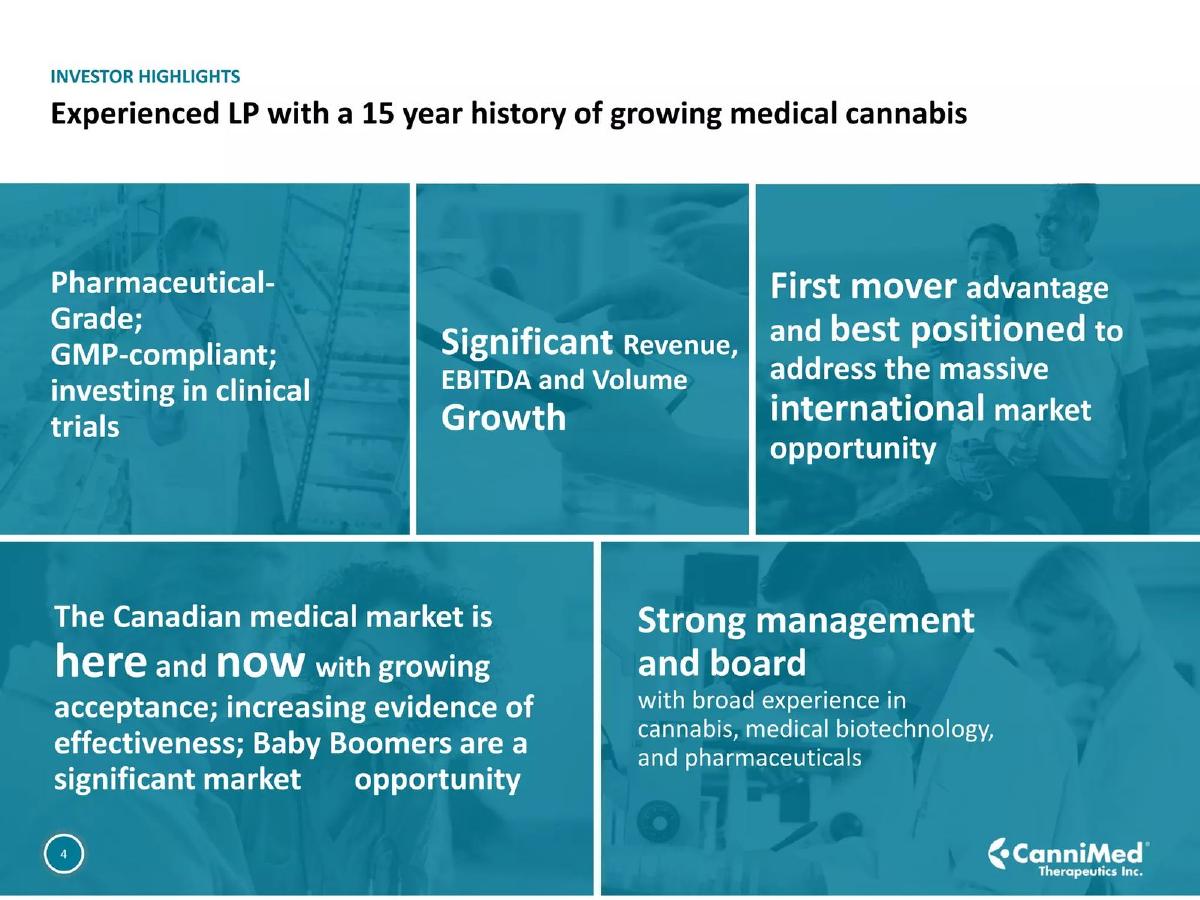
This slide provides a concise mission statement. CanniMed defines itself as an "international, biopharmaceutical company." The key takeaway here is the emphasis on "best-in-class pharmaceutical-grade cannabis products." By leading with their pharmaceutical credentials, they distance themselves from the burgeoning recreational market, targeting institutional investors who value regulatory compliance and medical validation.
Slide 5: Recent Developments and Traction
Slide 5 is the 'momentum' slide. It lists four major achievements: entering Canada's first exclusive pharmacy distribution agreement, commencing a facility expansion with provincial government support, licensing a thin-film wafer technology from CTT Pharmaceutical Holdings, and completing exports to Australia and the Cayman Islands. The left-hand margin highlights three critical KPIs: Revenue (+80% Q3/Q3) , Adjusted EBITDA (+$1.2MM 9mo/9mo) , and KG Sold (+79% 9mo/9mo) . These figures demonstrate that the company is not just growing in volume but improving its bottom line.
Slide 7: The Macro Opportunity
CanniMed identifies four pillars for the "Significant" opportunity in pharmaceutical cannabis: a rapidly aging population seeking pain relief, the risks associated with commonly prescribed opioids, increasing healthcare costs, and Canada's leadership in the legislative environment. This slide effectively links the company's success to global demographic shifts and the urgent need for non-addictive pain management alternatives.
Slide 9: International Market Expansion
This slide uses a world map to visualize CanniMed's global footprint. It highlights a "Worldwide population of baby boomers" exceeding 1.1 billion. Specific milestones include an LOI in the European Union , first-ever sales in the Cayman Islands , and shipments to Australia . Notably, it mentions a GMP-compliant facility in the United States with a capacity of 50,000 kg per annum, pending a DEA license for research purposes. This demonstrates a clear path to scaling beyond the Canadian border.
Slide 11: Product Offering and Branding
The herbal product slide is visually striking, showing a line of color-coded bottles ranging from "Purple 1-13" to "Indigo 22-1." Each product is identified by its specific THC and CBD percentage (e.g., Yellow 12-0 contains 12.5% THC and <0.5% CBD). The text notes that this branding "promotes doctor confidence" and supports "effective prescription dosages." This is a critical differentiator; they are selling standardized medicine, not just flower.
Slide 13: Production Facilities and Standards
This slide details the infrastructure in Saskatoon, Saskatchewan. The facility sits on 100 acres, currently utilizing 20 acres with 30 growth chambers. The current capacity is 7,000 kg , with plans to add up to 8,000 kg in 2018 and another 6,000 kg in 2018-19. The right side of the slide creates a hierarchy of standards, placing GMP Standards at the top ("Most Rigorous"), followed by ISO, and finally GPP ("Least Rigorous"). This reinforces their narrative of being the highest-quality producer in the space.
Slide 15: Revenue and Growth Metrics
Slide 15 provides the data to back up the growth claims. Active Patients grew 143% (from 7,631 to 18,512), and Physicians grew 47% (from 2,863 to 4,222). The most important chart on this slide shows the shift in revenue mix: Oil Equivalent (KG) grew by 282%, now representing 57% of revenue compared to 36% the previous year. This shift toward oils is generally indicative of higher margins and greater medical acceptance.
Slide 17: Capitalization Table
The capitalization slide shows a company in a very healthy financial position. Between October 2016 and July 2017, Cash increased from $2.0 million to $54.2 million. Shareholders Equity rose from $10.6 million to $90.8 million. The slide notes a Current Market Capitalization of $208.9 million as of September 12, 2017. This level of transparency is typical for a public entity and provides investors with a clear view of the company's valuation and liquidity.
Slide 19: Management and Board
The final slide in the set lists the leadership team. It is a "heavyweight" board, including Donald Ching (former CEO of SaskTel), Richard Hoyt (VP at Mallinckrodt PLC), and Brandon J. Price (Co-founder of Biogenin). The presence of Ph.D.s and pharmaceutical veterans like Bruce F. Mackler (FDA consultant) validates the company's claim to be a biopharmaceutical player rather than a simple greenhouse operator.
What Works in This Deck
The deck is exceptionally disciplined. It avoids the typical cannabis industry tropes of "green rush" hype and focuses entirely on clinical validation and regulatory moats . The use of GMP standards as a competitive advantage (Slide 13) is a powerful way to justify a premium valuation. Furthermore, the growth metrics (Slide 15) are presented with clear year-over-year comparisons, making the trajectory easy to digest. The product branding (Slide 11) is also a highlight; it looks like a pharmacy shelf, which is exactly what a medical investor wants to see.
What Is Missing
While the deck is strong on performance, the provided slides lack a clear "Use of Proceeds" or a specific "Ask." Since this is a Q3 update, it may be intended for existing shareholders or the public market, but for a fundraising teardown, the absence of a future-looking financial forecast (beyond capacity expansion) is a gap. Additionally, there is no Competitor Analysis slide. In 2017, the Canadian market was becoming crowded with players like Canopy Growth and Aurora; CanniMed’s failure to explicitly chart their position relative to these peers is a missed opportunity to highlight their specific pharmaceutical niche.
Founder Takeaways
Standardize Your Product: If you are in a regulated space, show how your product meets or exceeds those regulations. CanniMed’s color-coded THC/CBD breakdown is a perfect example of making a complex product easy for professionals to prescribe. · Metrics Matter: Don't just show total sales. Show the mix of sales. CanniMed’s highlight of the 282% growth in oil equivalents (Slide 15) tells a story of moving toward higher-value products. · Build a Relevant Board: A cannabis company with an FDA consultant and a former pharmaceutical VP on the board has instant credibility. Your team slide should reflect the industry you want to be in, not just the one you are currently in. · Visualizing Scale: Use maps and facility specs to show physical defensibility. The 100-acre site and bio-secure chambers (Slide 13) suggest a barrier to entry that a small-scale grower cannot match.
Frequently asked questions
- What is CanniMed's primary value proposition?
- CanniMed positions itself as a biopharmaceutical leader rather than a recreational cannabis company. As stated on Slide 3, they focus on 'best-in-class pharmaceutical-grade cannabis products.' This is reinforced by their GMP-compliant production facilities and a product line designed to provide doctors with precise THC/CBD dosages, aiming to replace commonly prescribed opioids for pain management in aging populations.
- How does CanniMed differentiate its production process?
- According to Slide 13, CanniMed utilizes a 'Seventh Generation' facility that is GMP-compliant, which is the most rigorous standard for pharmaceutical production. They contrast this against the 'least rigorous' Good Production Practices (GPP) required under standard Canadian regulations. Their facility includes 30 bio-secure growth chambers and level 7 security vaults, emphasizing medical-grade consistency over agricultural scale.
- What do the growth metrics indicate about their market traction?
- The metrics on Slide 15 show aggressive scaling. Beyond the 143% increase in active patients, the number of physicians prescribing their products grew by 47% to 4,222. Most notably, their high-margin oil products saw a 282% increase in volume, indicating a successful shift toward more sophisticated delivery methods preferred by the medical community.
- What is CanniMed's international strategy?
- Slide 9 outlines a global approach targeting a baby boomer population of over 1.1 billion. They have already executed sales in the Cayman Islands and Australia. Their strategy involves leveraging their GMP-compliant status to enter highly regulated markets like the EU (via an LOI with Creso Pharma) and the U.S., where they are applying for a DEA license for research supply.
- What was the company's financial standing at the time of this deck?
- Slide 17 shows a dramatic improvement in liquidity between 2016 and 2017. Cash reserves jumped from $2.0 million to $54.2 million, while debt was reduced from $36.3 million to $14.0 million. With a market capitalization of $208.9 million and an enterprise value of $168.7 million, the company was well-capitalized for its planned facility expansions.