The November 2017 Alteryx investor presentation is a highly technical, post-IPO style deck that prioritizes operational efficiency and cohort-based growth metrics over early-stage storytelling. By focusing on the 'Thrill of Solving,' Alteryx positions itself as the central nervous system for enterprise data, bridging the gap between fragmented inputs like Hadoop and Salesforce and outputs like Tableau and Power BI. The deck is notable for its explicit breakdown of the 'Land and Expand' model, using a cohort analysis slide to show a 2.7x revenue increase from the 2014 customer group by year th…
Key takeaways
- The deck identifies a massive pain point where 94% of organizations use multiple data sources, creating a manual labor trap (Slide 9).
- Advanced spreadsheet users are shown to spend 26 hours per week on repetitive manual tasks, providing a clear ROI hook for automation (Slide 9).
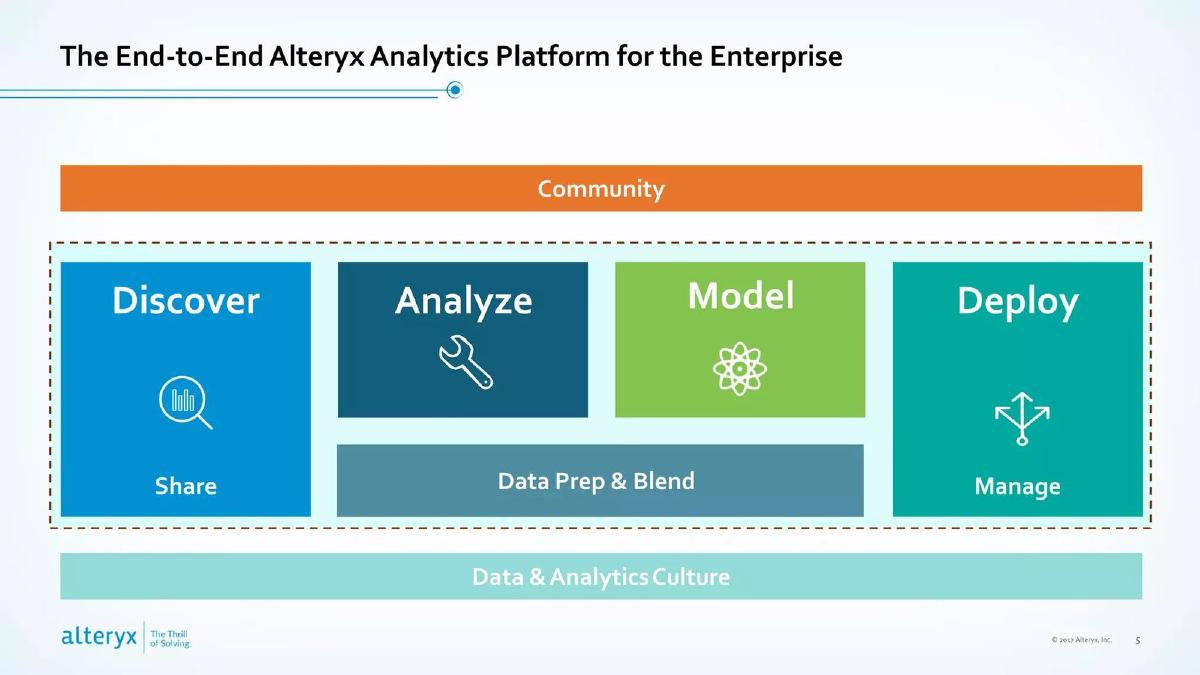
- Alteryx positions its platform as a four-step workflow: Discover/Share, Analyze, Model, and Deploy/Manage (Slide 5).
- The 'Land and Expand' model is validated by data showing the 2014 cohort grew to 2.7x its original size by its third year (Slide 29).
- The platform acts as a universal translator, connecting over 15 input sources to nearly a dozen output formats including Qlik and Oracle (Slide 13).
- Future growth is mapped across six distinct drivers, ranging from international expansion to deepening the user community (Slide 21).
- Financial maturity is demonstrated through a detailed GAAP to Non-GAAP reconciliation table, showing a shift toward positive Non-GAAP margins in Q3 2017 (Slide 37).
- The business model relies on 1-3 year subscription licenses billed annually, creating predictable, high-visibility revenue (Slide 25).
Introduction
The Alteryx Investor Presentation from November 2017 serves as a blueprint for how a scaling SaaS company communicates complex technical value to a financial audience. At this stage, Alteryx was focused on proving the scalability of its enterprise platform and the efficiency of its sales motion. The deck avoids the fluff of early-stage pitches, opting instead for data-heavy slides that emphasize market friction, product interoperability, and cohort-based growth metrics. It is a presentation designed for investors who value unit economics and platform stickiness over visionary speculation.
Slide 1: Title Slide
The cover slide is minimalist, featuring the Alteryx logo and the tagline "The Thrill of Solving." The date, November 2017, places this deck in a period of significant growth for the company. The visual motif of intersecting lines with nodes suggests connectivity and data flow, which are central themes of the product. There is no clutter here; the focus is entirely on the brand and the specific moment in time.
Slide 5: The End-to-End Analytics Platform
This slide defines the functional scope of the Alteryx platform. It breaks the user journey into four primary blocks: Discover/Share , Analyze , Model , and Deploy/Manage . Beneath these functional pillars sits "Data Prep & Blend," which is historically Alteryx's core strength. The slide also emphasizes two cultural layers: "Community" at the top and "Data & Analytics Culture" at the bottom. This suggests that Alteryx isn't just a tool, but a framework for how an entire enterprise handles data. By framing the platform as "End-to-End," they are signaling to investors that they aim to own the entire data lifecycle, reducing the need for competitors.
Slide 9: The Data Asset Challenge
Slide 9 is the "Problem" slide, and it uses hard statistics to create urgency. It cites three key metrics: 94% of organizations use multiple data sources, 60%+ have five or more sources, and advanced spreadsheet users spend 26 hours per week on repetitive manual tasks. The inclusion of citations from IDC and Harvard Business Review adds institutional credibility. This slide effectively quantifies the "cost of doing nothing." For an investor, the 26-hour figure represents a massive opportunity for labor cost savings, which justifies the enterprise software spend.
Slide 13: The Interoperability Ecosystem
This is arguably the most important technical slide in the deck. It visualizes the Alteryx Platform (Designer and Server) as a central processing hub. On the left, it lists a diverse range of Inputs , including Amazon Web Services, Salesforce, and Hadoop. In the center, it shows how Alteryx "Enriches" data using third-party sources like the U.S. Census, Experian, and Dun & Bradstreet. On the right, it displays Outputs to major BI tools like Tableau, Qlik, and Power BI. This slide proves that Alteryx is "glue" software—it doesn't require customers to rip and replace their existing stack; it makes their existing stack more valuable.
Slide 17: Enterprise Case Study (Shell)
Using a massive brand like Shell provides immediate social proof. The slide doesn't just list the logo; it lists the specific business units where Alteryx is deployed: Exploration, Upstream Operations, Carbon Capture & Storage, Lubricants Supply Chain, Downstream Retail, and Trading Compliance. This list demonstrates the versatility of the product. If it can handle the complex, high-stakes data of a global oil and gas giant across six different divisions, it can likely handle any enterprise use case. The visual of an oil rig reinforces the "industrial-grade" nature of the software.
Slide 21: Future Growth Drivers
This slide provides a roadmap for the company's expansion. It uses a rising curve to plot six drivers: Increase Customer Base , Expand Current Customer Base , Grow Into International Markets , Extend Our Value Proposition , Grow Channel Ecosystem , and Deepen User Community . This is a standard but effective way to show that the company has multiple levers to pull. It assures investors that growth isn't dependent on a single strategy, such as just finding new logos, but also includes deepening existing relationships and expanding geographically.
Slide 25: The Business Model
Slide 25 breaks down the mechanics of how Alteryx makes money. It highlights five key elements: Downloadable Software , Subscription Licenses (billed annually on 1-3 year contracts), an Efficient Customer Acquisition Model , a Land and Expand Model , and the Opportunity to Upsell . By explicitly stating the contract lengths and billing cycles, Alteryx is highlighting its revenue predictability and cash flow characteristics. The mention of a "Short Sales Cycle" is a specific competitive advantage in the often-slower world of enterprise software.
Slide 29: Cohort Expansion Data
This is the "proof" slide for the Land and Expand model mentioned earlier. It tracks three cohorts (2014, 2015, and 2016). The 2014 cohort is the standout, showing that revenue from those specific customers grew to 2.7x the original amount by year three. The 2015 cohort grew to 1.9x by year two. This visualization of Net Revenue Retention (NRR) is a critical metric for SaaS investors. It proves that the product is sticky and that customers naturally find more ways to use it (and pay for it) over time.
Slide 37: Financial Reconciliations
The final data slide is a GAAP to Non-GAAP reconciliation table. This is a high-maturity financial slide. It shows that while the company reported a GAAP loss of $23.022 million in 2016, its Non-GAAP adjusted loss was $19.738 million . More importantly, it shows a trend toward profitability: in Q3 2017, the Non-GAAP margin turned positive at 3% ($885,000). This slide is designed to show institutional investors that the company is managing its path to profitability responsibly, accounting for stock-based compensation and one-time costs.
What Alteryx Does Well
Alteryx excels at quantifying the pain point. By citing the 26 hours per week spent on manual spreadsheet tasks, they move the conversation from "nice-to-have tool" to "essential efficiency engine." Their use of cohort data (Slide 29) is a masterclass in demonstrating product-market fit and expansion potential without using vague adjectives. Furthermore, the ecosystem slide (Slide 13) clearly defines their position in the market as a platform-agnostic integrator, which is a highly defensible position in a fragmented enterprise landscape.
What is Missing from the Deck
In the selection provided, there are a few notable omissions. First, there is no Team Slide . While Alteryx was a public company or near-IPO at this stage, identifying the key leadership and their backgrounds in data science or enterprise sales is usually standard. Second, there is no Competitive Landscape slide. The deck assumes the investor already understands who the competitors are (likely SAS or manual Python/R coding), but a direct comparison of why Alteryx wins would have strengthened the pitch. Finally, there is no specific Use of Funds or "Ask" slide, which is typical for a general investor presentation rather than a specific fundraising round deck.
What Founders Should Copy
Quantify the Labor: Don't just say your software saves time. Say exactly how many hours the current manual process takes (Slide 9). · Visualize the Workflow: If you have a platform, show the inputs and outputs. Investors need to see where your product sits in the customer's existing stack (Slide 13). · Use Cohorts to Prove Expansion: If you claim a 'Land and Expand' model, you must show a cohort chart. Nothing proves stickiness better than showing that a 2014 customer is paying 2.7x more in 2017 (Slide 29). · Social Proof with Specifics: When using a case study, don't just show the logo. List the specific departments using the tool to show breadth of application (Slide 17). · Financial Transparency: As you scale, move toward GAAP/Non-GAAP reconciliations. It shows you have a professional finance function and understand your true operational margins (Slide 37).
Frequently asked questions
- What is the primary value proposition Alteryx presents to enterprises?
- Alteryx focuses on eliminating the 'manual labor' of data science. According to Slide 9, advanced spreadsheet users spend 26 hours a week on repetitive tasks. Alteryx offers an end-to-end platform that automates the prep, blend, and analysis phases, allowing users to move from fragmented data sources to actionable insights in tools like Tableau or Power BI much faster than manual methods.
- How does Alteryx prove its 'Land and Expand' strategy is working?
- The company uses a cohort analysis on Slide 29. It shows that the 2014 cohort of customers grew by 170% (reaching 2.7x the base year revenue) by year three. The 2015 cohort showed 90% growth (1.9x) by year two. This visual evidence demonstrates that once Alteryx enters an organization, it successfully upsells additional licenses and expands its footprint over time.
- What does the platform's technical ecosystem look like?
- Slide 13 illustrates a highly interoperable ecosystem. It accepts inputs from cloud services (AWS), legacy databases (SAS, MongoDB), and SaaS tools (Salesforce, Marketo). It then 'enriches' this data with third-party sets like Experian or TomTom before outputting to visualization tools (Tableau, Qlik), databases (SQL Server, Oracle), or flat files (Excel, JSON).
- What are the specific drivers for Alteryx's future growth?
- Slide 21 outlines six pillars: increasing the total customer base, expanding within current customers, growing into international markets, extending the value proposition (product features), growing the channel ecosystem (partners), and deepening the user community. This suggests a multi-pronged approach rather than relying solely on new customer acquisition.
- Is Alteryx profitable according to this 2017 deck?
- Slide 37 shows that Alteryx was not profitable on a GAAP basis, reporting a loss from operations of $23.022 million in 2016. However, it highlights a 'Non-GAAP' turning point in Q3 2017, where it achieved a positive $885,000 in adjusted income, representing 3% of revenue, compared to a 13% loss in the same quarter the previous year.