Worldfavor’s 14-slide Series A deck focuses heavily on the structural inefficiency of the current ESG landscape. By positioning itself as a two-sided platform rather than a simple SaaS tool, the company addresses the 'reporting fatigue' of data providers while offering a centralized hub for data accessors. The deck defines a €5.5B Total Addressable Market across the EU and USA, specifically targeting 303,949 large enterprises. While the deck excels at explaining the 'why' and the 'how' of their network effect—offering free access to data providers to drive supply—it notably lacks specific tra…
Key takeaways
- The company identifies a €5.5B Total Addressable Market (TAM) covering 303,949 large enterprises in the EU and USA (Slide 5).
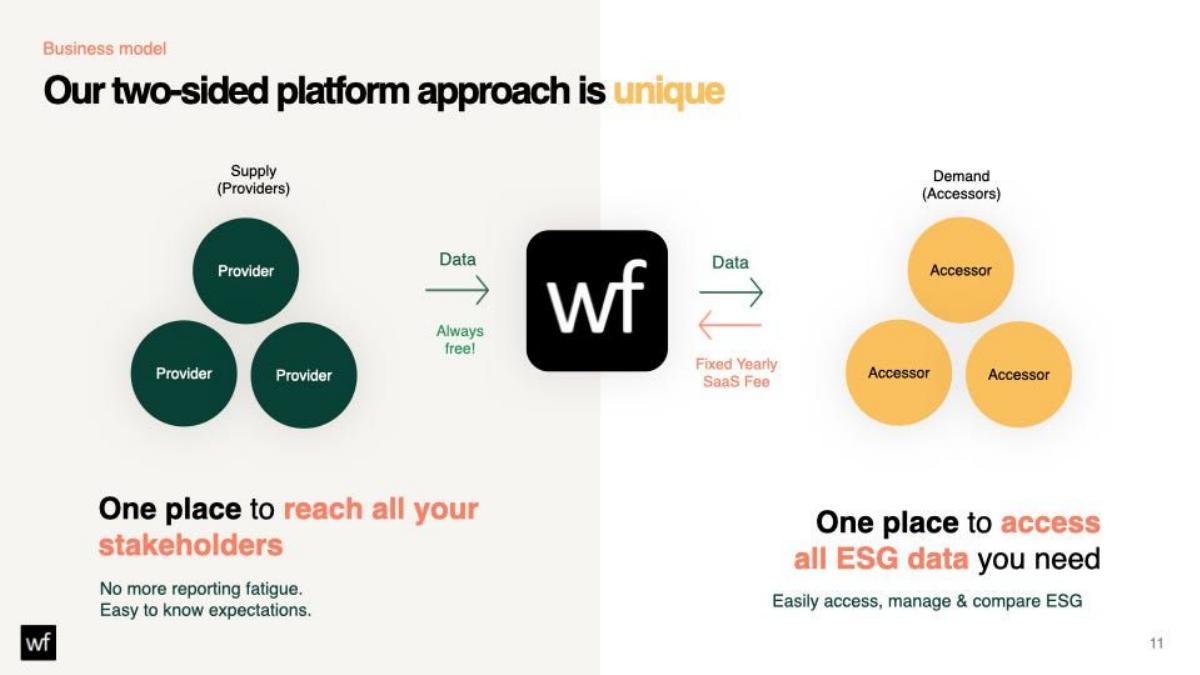
- Worldfavor utilizes a two-sided business model where data is 'Always free!' for providers to encourage platform adoption (Slide 11).
- The Serviceable Addressable Market (SAM) is narrowed down to €3.8B, representing 212,765 large enterprises (Slide 5).
- The problem is framed as 'two-sided,' citing reporting fatigue for providers and scattered, complex data for accessors (Slide 9).
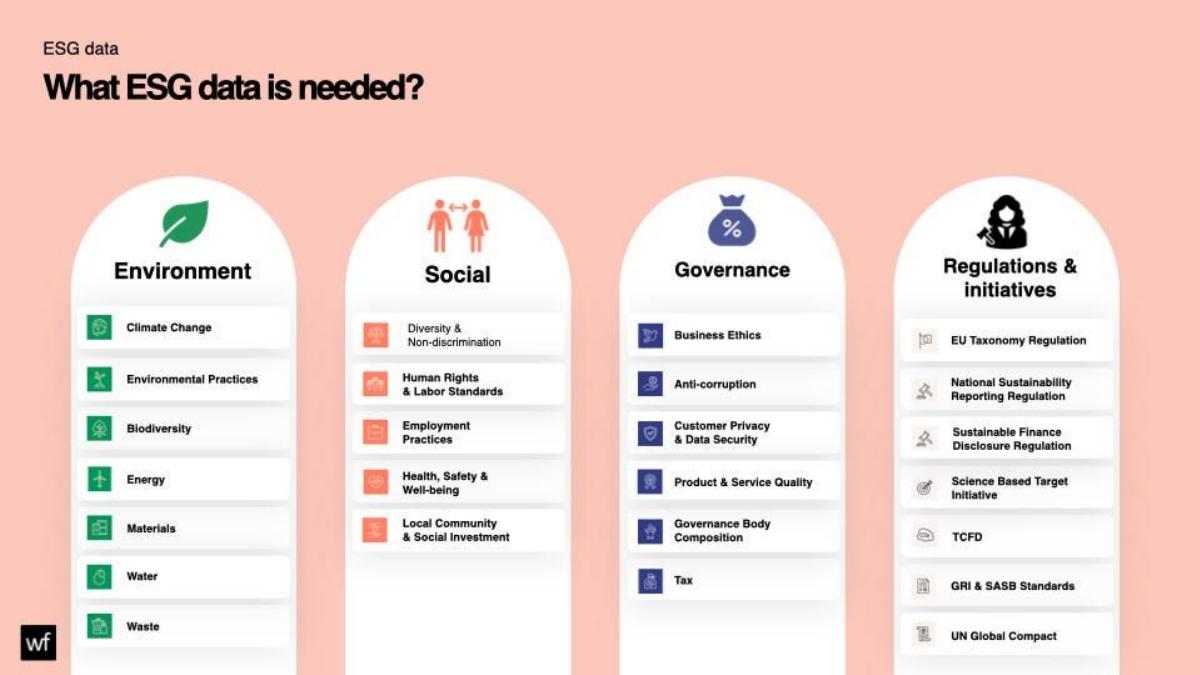
- The platform categorizes ESG data into four pillars: Environment, Social, Governance, and Regulations & Initiatives (Slide 6).
- Current private company ESG data is criticized as being non-harmonized, non-comparable, non-centralized, non-actual, and non-existent (Slide 7).
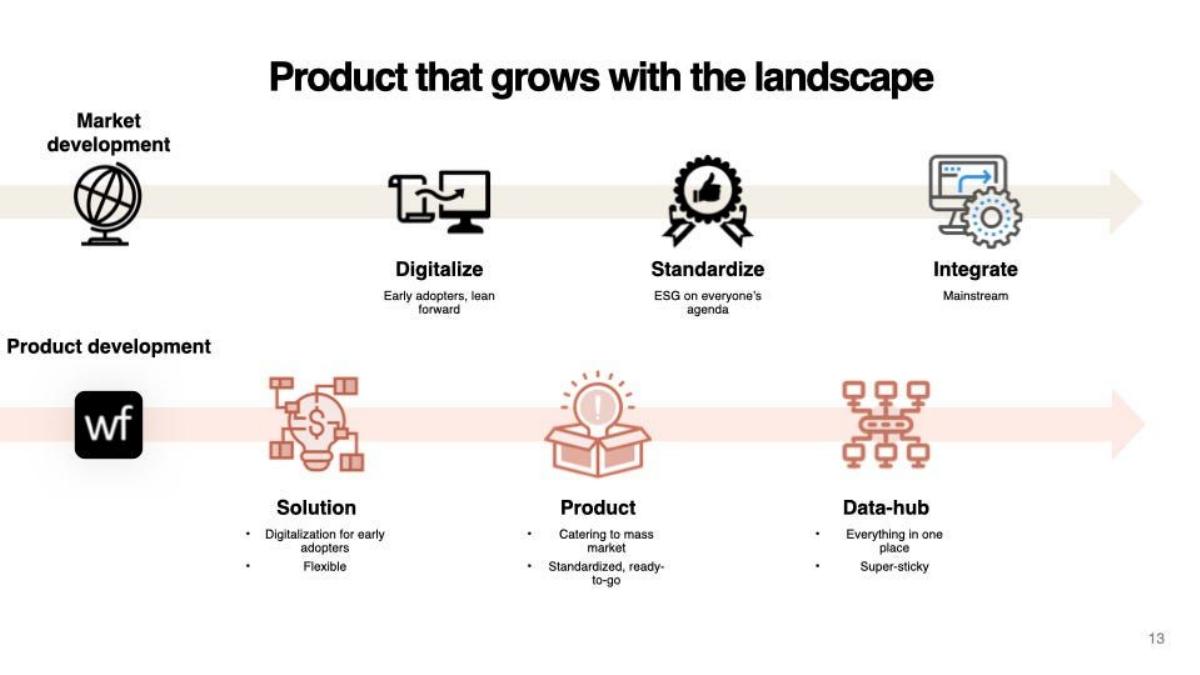
- The product roadmap transitions from a flexible 'Solution' for early adopters to a 'Data-hub' that is described as 'super-sticky' (Slide 13).
- Revenue is generated through a 'Fixed Yearly SaaS Fee' charged specifically to the 'Accessors' (demand side) of the data (Slide 11).
The Narrative: From ESG Chaos to Centralized Data
Worldfavor’s Series A deck is a masterclass in defining a systemic problem. Instead of focusing on the features of a software tool, the deck focuses on the failure of a market. By 2024, ESG (Environmental, Social, and Governance) reporting had become a mandatory burden for large enterprises, yet the data remained siloed. Worldfavor uses its 14 slides to argue that the only solution is a network-based platform that incentivizes data sharing by making it free for the suppliers.
Slide 1-4: The Vision and Positioning
The deck opens with a clear, bold mission statement: "The global platform for company ESG data." The sub-text on Slide 1 emphasizes "connecting companies" and "true impact at scale." This immediately signals to investors that this is not a consulting play or a niche reporting tool, but a horizontal infrastructure play. The repetition of the title slide in the provided sequence suggests a focus on branding and the core message of connectivity.
Slide 5: The €5.5B Market Opportunity
Worldfavor provides a specific, quantified view of their market. They break down the opportunity into two tiers:
TAM (EU + USA): €5.5B, representing 303,949 large enterprises. · SAM (EU + USA): €3.8B, representing 212,765 large enterprises.
The slide lists three drivers for this market: increasing regulations, increasing business needs (staying competitive), and increasing awareness. By citing the number of enterprises, they give investors a way to calculate potential penetration rates. The focus on the EU and USA reflects the regions with the most mature ESG regulatory frameworks, such as the CSRD in Europe.
Slide 6: Defining the Data Scope
ESG is often criticized for being vague. Slide 6 combats this by categorizing exactly what data the platform handles. It is divided into four pillars: Environment, Social, Governance, and Regulations & Initiatives. Notable inclusions are the EU Taxonomy Regulation, TCFD, and GRI/SASB standards. This slide serves as a product scope document, showing that the platform is built to handle the complexity of global reporting standards rather than just simple carbon tracking.
Slide 7-9: The Problem of Fragmentation
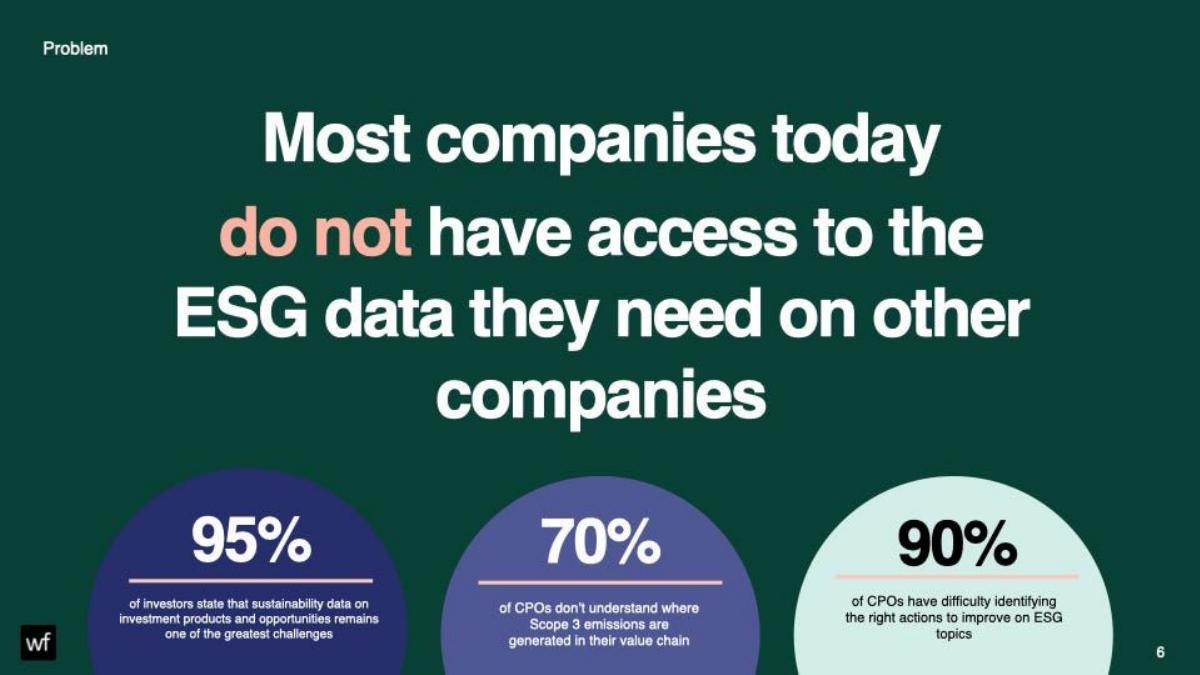
Slide 7 uses iconography to describe the current state of private company ESG data as "non-harmonized," "non-comparable," and "non-existent." This sets the stage for Slide 9, which identifies a "two-sided problem." On one side, providers are suffering from "reporting fatigue" because they have to report the same data to multiple stakeholders. On the other side, accessors find the data "scattered" and "complex." This is the pivot point of the deck: the problem isn't just that data is hard to find; it's that the process of providing it is broken.
Slide 11: The Two-Sided Business Model
This is the most important slide for understanding Worldfavor’s competitive advantage. Most ESG tools charge both sides or charge the supplier to be audited. Worldfavor flips this:
Supply (Providers): Data entry is "Always free!" This removes the friction for suppliers to join the platform. · Demand (Accessors): Large enterprises and investors pay a "Fixed Yearly SaaS Fee" to access the aggregated and compared data.
This model is designed to create a network effect. As more providers join for free to satisfy one accessor, the platform becomes more valuable to other accessors who want to reach those same providers.
Slide 13: The Product Evolution
Slide 13 maps the company’s trajectory against market development. It shows a transition from a "Solution" (digitalization for early adopters) to a "Product" (standardized for the mass market) to a "Data-hub." The goal is to become a "super-sticky" data hub where everything is in one place. This roadmap suggests that Worldfavor is currently in the transition from a tool to an essential piece of industry infrastructure.
What Worldfavor Does Well
The deck is exceptionally strong at defining the network effect . By making the supply side free, they address the biggest hurdle in supply chain transparency: supplier resistance. Most companies struggle to get 100% compliance from their vendors because those vendors don't want to pay for another reporting tool. Worldfavor removes that barrier.
Furthermore, the market segmentation on Slide 5 is grounded in reality. By using enterprise counts rather than just vague billion-dollar figures, they demonstrate a bottom-up understanding of their sales targets. The visual design is clean and uses a consistent color palette to differentiate between the supply side (green) and the demand side (yellow/orange), making the two-sided model easy to digest at a glance.
What is Missing from the Deck
Despite raising $10.5M, this version of the deck leaves several critical questions unanswered for a Series A investor: 1. Traction Metrics: There is no mention of current ARR, the number of active users, or the number of connections on the platform. For a network-effect business, the number of "nodes" (companies) and "edges" (data shares) is the most important metric, yet it is absent here. 2. The Team: A Series A is as much about the team as the product. This deck omits the founders' backgrounds and the engineering talent required to build a global data hub. 3. Competitive Analysis: The ESG space is crowded with players like EcoVadis, Watershed, and Persefoni. Worldfavor does not explicitly state how it wins against these incumbents, other than the implication of its free provider model. 4. Financial Projections and Ask: The deck does not state how much they are raising (though we know it was $10.5M from external reports) or how they plan to allocate that capital across sales, marketing, and R&D.
Founder Takeaways
Founders building in the data management or supply chain space should take note of Worldfavor’s problem framing . By presenting the issue as a "two-sided problem," they justify a business model that might otherwise look like they are "leaving money on the table" by not charging suppliers. They successfully argue that the long-term value of the data hub outweighs the short-term gain of per-seat supplier licenses.
Additionally, the use of regulatory milestones as market drivers is a smart way to create urgency. Slide 5 and 6 tie the product directly to legal requirements like the EU Taxonomy, making the purchase of Worldfavor seem like a necessity rather than a discretionary spend. If you are in a regulated industry, your deck should clearly map your product features to specific regulatory articles or deadlines.
Frequently asked questions
- What is Worldfavor's primary value proposition?
- Worldfavor positions itself as a global platform for company ESG data. Its primary value is connecting companies to share and access sustainability information easily. By acting as a centralized hub, it aims to eliminate 'reporting fatigue' for suppliers who currently have to report the same data into multiple silos, while providing investors and large enterprises with comparable, actual data.
- How does Worldfavor make money?
- According to Slide 11, Worldfavor uses a two-sided platform approach. They provide the platform for free to 'Providers' (the supply side) to ensure a high volume of data enters the ecosystem. They monetize by charging 'Accessors' (the demand side) a fixed yearly SaaS fee to access, manage, and compare that ESG data.
- What market size is Worldfavor targeting?
- On Slide 5, the company identifies a Total Addressable Market (TAM) of €5.5B, which includes over 300,000 large enterprises across the EU and USA. They further refine this to a Serviceable Addressable Market (SAM) of €3.8B, targeting approximately 212,000 large enterprises that have immediate needs due to increasing regulations and business pressures.
- What specific ESG data points does the platform track?
- Slide 6 outlines a comprehensive list including Climate Change, Biodiversity, and Energy (Environment); Human Rights and Diversity (Social); and Business Ethics and Anti-corruption (Governance). It also tracks compliance with specific frameworks like the EU Taxonomy, TCFD, GRI, SASB, and the UN Global Compact.
- What is missing from this pitch deck?
- This version of the deck is missing several critical Series A components. There is no team slide highlighting founder expertise, no financial slide showing historical ARR or growth rates, and no 'Ask' slide detailing how the $10.5M will be spent. It also lacks a competitive landscape analysis beyond general statements about the 'non-centralized' nature of current data.