Citylitics, a data management platform for the public infrastructure sector, successfully raised $5M in Series A funding in 2022. Their 14-slide deck focuses heavily on the transition from a legacy 'old boys' network' to a data-driven 'new reality' in infrastructure procurement. By positioning themselves as the 'Bloomberg of Infrastructure,' the company highlights a massive $2.1T US market opportunity. The deck is notable for its extensive social proof, featuring a logo wall of over 50 major industry players, and a clear technical explanation of their data aggregation pipeline. While the deck…
Key takeaways
- The company identifies a $5.7T global annual spend on infrastructure, with a specific $2.1T industry size in the US (Slides 3 and 12).
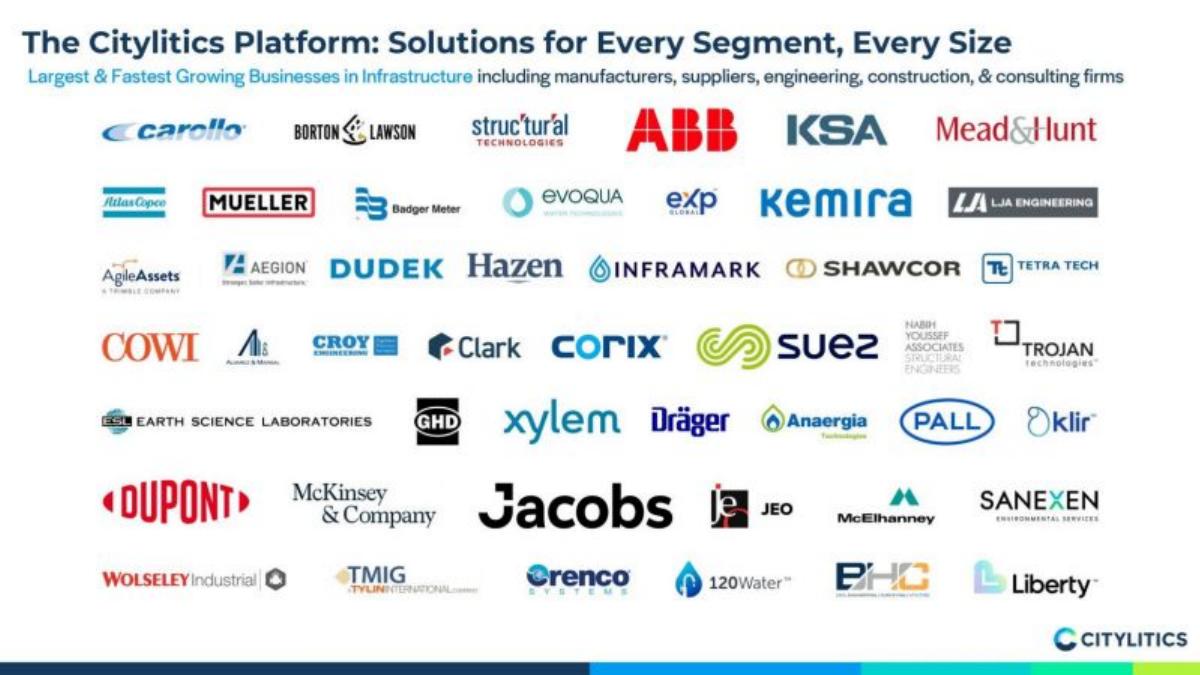
- A massive customer logo wall includes major firms like DuPont, Jacobs, McKinsey & Company, and ABB, demonstrating deep market penetration (Slide 5).
- The platform aggregates data every 2 weeks from over 30,000 city, utility, and public agency websites (Slide 8).
- Citylitics uses a Netflix-style feedback loop analogy to explain how user ratings improve their intelligence models (Slide 9).
- The deck positions the company against established data giants like Bloomberg ($10B/year revenue) and CoStar ($1.4B/year revenue) to anchor valuation expectations (Slide 12).
- The 'Perfect Storm' slide cites government stimulus, climate change, and COVID-19 as immediate catalysts for growth (Slide 11).
- The deck omits a dedicated team slide, which is unusual for a Series A raise (Slide 1-14).
- Specific financial performance metrics, such as ARR or churn rates, are not disclosed in the slides (Slide 1-14).
The Macro Thesis: Redefining a Trillion-Dollar Legacy Industry
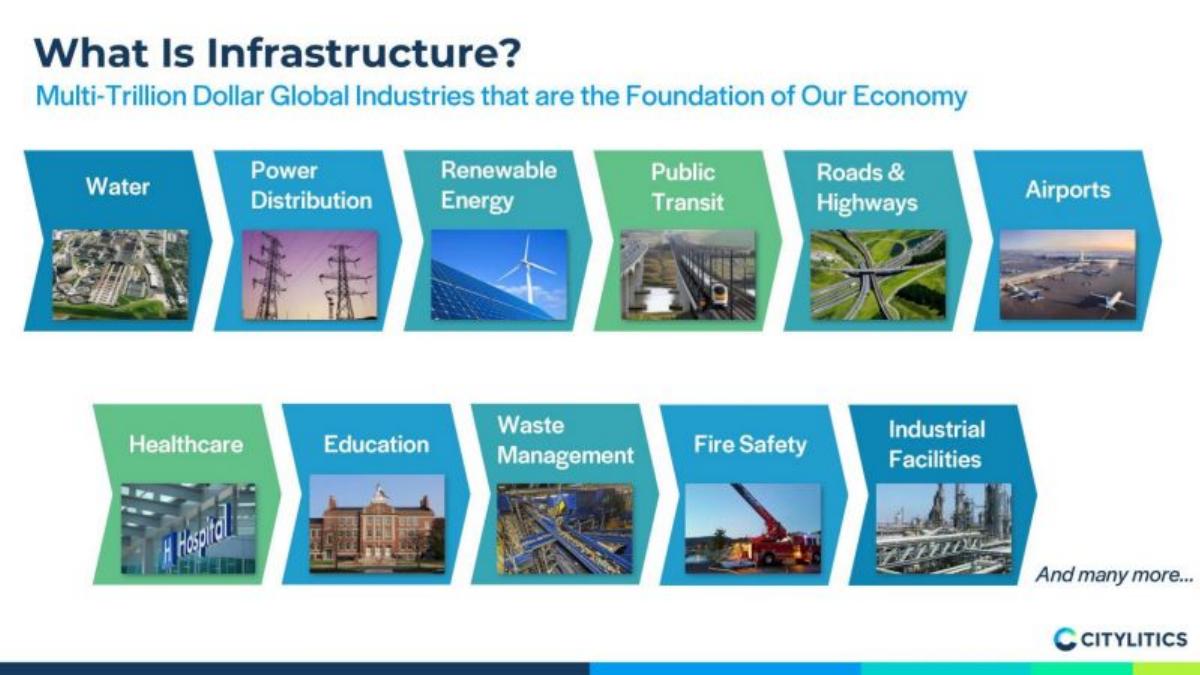
Citylitics entered the market in 2022 with a Series A deck that leans heavily into the 'inevitability' of digital transformation in the public infrastructure sector. The deck, titled 'Redefining Infrastructure Procurement,' sets the stage by defining infrastructure not just as roads and bridges, but as a multi-trillion dollar foundation of the global economy including water, renewable energy, healthcare, and education (Slide 2). By framing the sector this broadly, they immediately expand the TAM (Total Addressable Market) in the investor's mind.
Slide 1: Title and Positioning
The cover slide is minimalist, featuring the Citylitics logo and the tagline 'Redefining Infrastructure Procurement.' Dated December 2021, it establishes the company's focus on the 'procurement' side of the infrastructure lifecycle, which is where the money moves.
Slides 2-3: The Problem and the Opportunity
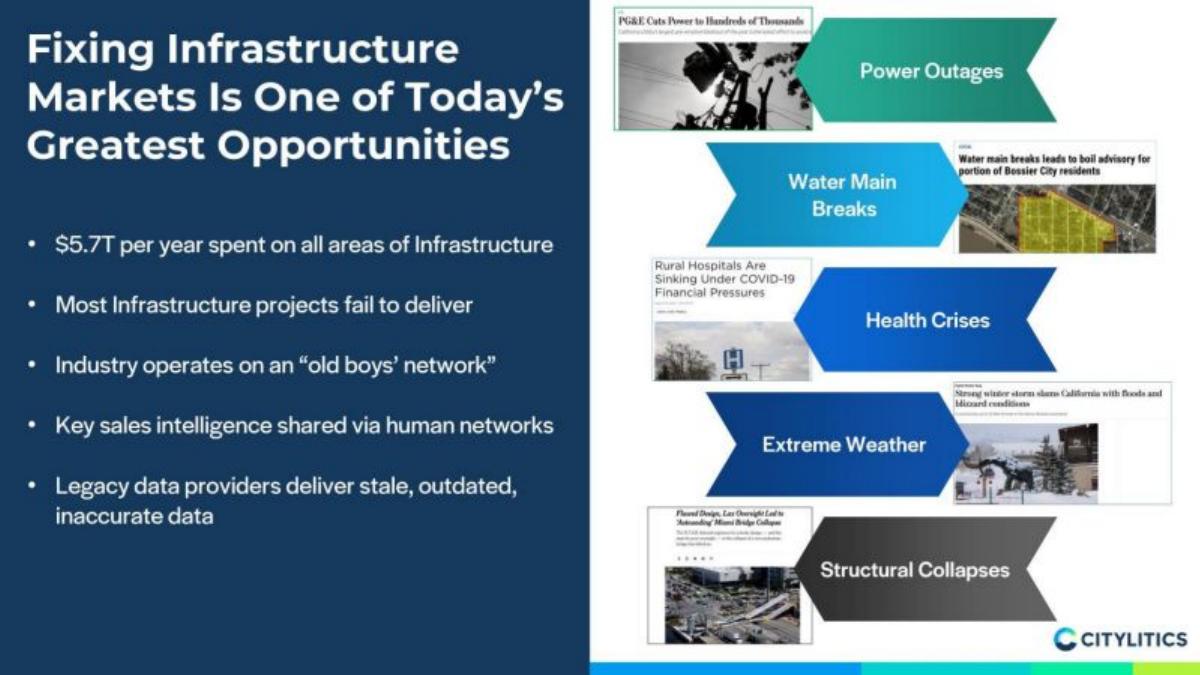
Slide 2 defines the scope of infrastructure, listing sectors like Power Distribution, Public Transit, and Waste Management. Slide 3 moves into the 'Why Now' by stating that $5.7T is spent annually on infrastructure, yet most projects fail to deliver because the industry operates on an 'old boys’ network.' This is a classic 'information asymmetry' problem. They highlight that legacy data is 'stale, outdated, and inaccurate,' creating a vacuum for a modern data provider.
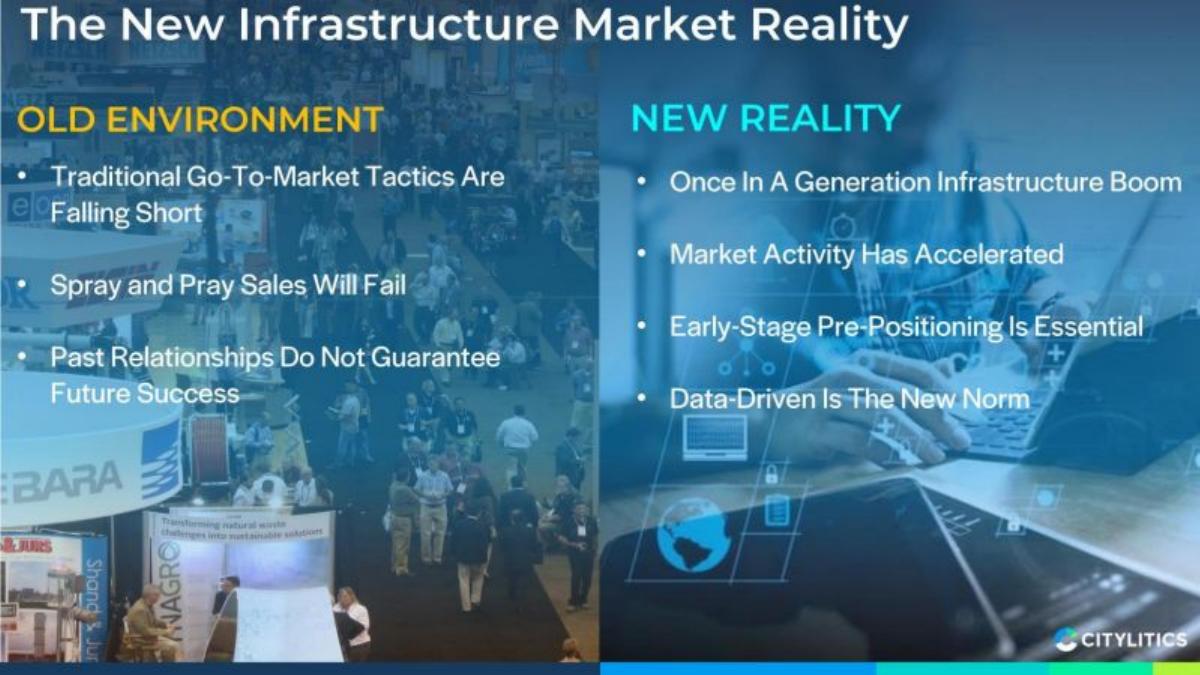
Slide 4: The New Market Reality
This slide uses a 'Before vs. After' comparison. The 'Old Environment' is characterized by 'Spray and Pray Sales' and reliance on past relationships. The 'New Reality' is defined by a 'Once In A Generation Infrastructure Boom' where 'Early-Stage Pre-Positioning Is Essential.' This slide is critical because it tells investors that the old way of doing business is no longer viable due to the sheer volume of new activity.
Slide 5: The Social Proof Powerhouse
Slide 5 is perhaps the strongest in the deck. It features a massive logo wall of over 50 customers. Seeing names like McKinsey & Company , DuPont , Jacobs , and ABB on a Series A deck is highly unusual and suggests that the product has already achieved significant market fit among the industry's top tier. This slide effectively de-risks the investment by showing that the industry's giants are already paying for the service.
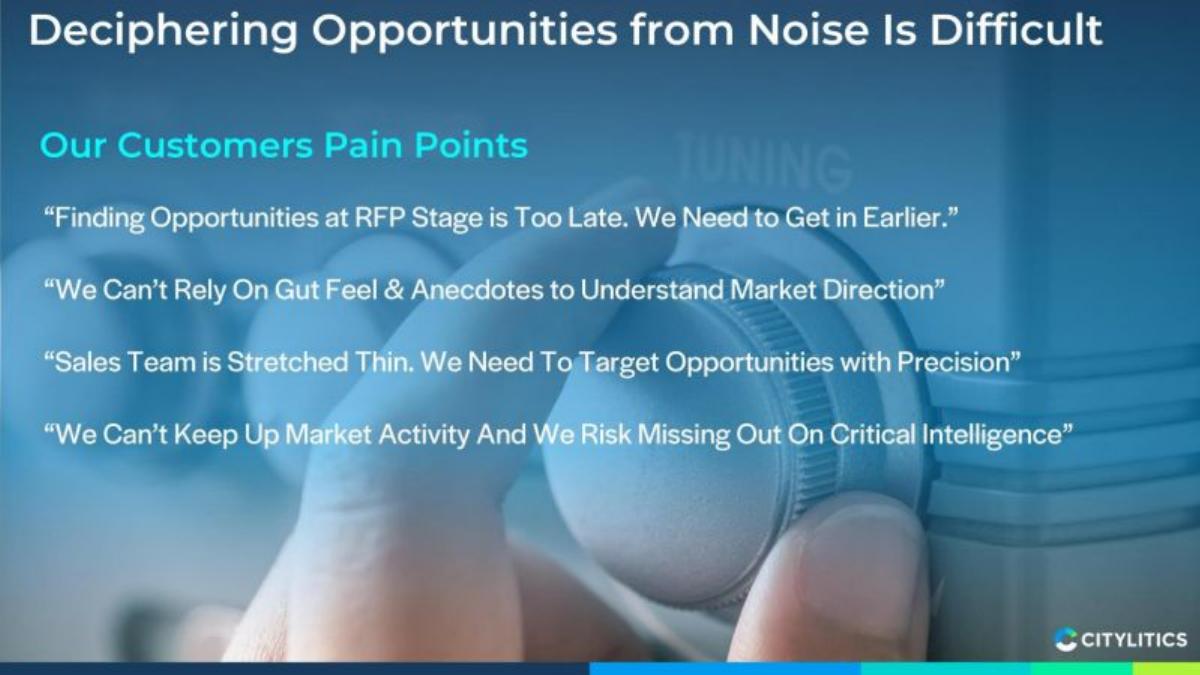
Slides 6-7: Customer Pain Points and Desires
Slide 6 uses direct quotes to illustrate customer frustration, such as 'Finding Opportunities at RFP Stage is Too Late.' This reinforces the value proposition of 'pre-positioning.' Slide 7 follows up with the solution: sales teams want to be 'Targeted, Precise, & Data-Driven.' The use of a bullseye graphic is a bit cliché, but the message is clear: Citylitics is the tool that provides the aim.
Slide 8: The Data Pipeline
This slide explains the 'how.' Citylitics uses a proprietary web crawler to aggregate data from 30,000+ city, utility, and public agency websites every two weeks. They then use Machine Learning (ML) for categorization and Natural Language Processing (NLP) for extraction. This technical breakdown is necessary to prove that the platform is a scalable software solution rather than a manual research shop.
Slide 9: The Feedback Loop
To explain their competitive moat, Citylitics uses a Netflix analogy. Just as Netflix uses viewing habits to improve recommendations, Citylitics uses user ratings ('Useful' vs. 'Not Useful') to update their intelligence models. This 'Unassailable Feedback Loop' suggests that the more customers they have, the better their data becomes, creating a natural barrier to entry for competitors.
Slide 10: The Product Roadmap
Slide 10 shows the evolution of the company from a 'Data Foundation' to an 'Infrastructure Marketplace.' Interestingly, two bullet points under 'Integrated Insights' are redacted as CONFIDENTIAL . This is a common tactic in public-facing decks to protect the roadmap while signaling to investors that there is more 'under the hood.'
Slide 11: The Perfect Storm
This slide synthesizes the macro environment. It cites Government Stimulus (trillions of dollars), Extreme Infrastructure Stress (climate change), and the Role of Cities (post-COVID rethinking) as the primary drivers. By linking their growth to these global shifts, they make the business feel like a 'must-have' rather than a 'nice-to-have.'
Slide 12: The Bloomberg Analogy
This is the 'valuation' slide. Citylitics compares itself to Bloomberg ($10B revenue), CoStar ($1.4B revenue), and ZoomInfo ($0.5B revenue). They note the US Infrastructure Industry size is $2.1T , which is comparable to the Real Estate and B2B Sales sectors. This anchors the investor's mind to the idea that Citylitics could eventually become a multi-billion dollar revenue company if it becomes the 'de facto' platform for its sector.
Slide 13: Contact Information
The final slide lists office locations in Toronto, Milwaukee, and Austin. It provides a general 'hello@' email address, which is standard for a closing slide.
What Works in This Deck
The Logo Wall: Slide 5 is the standout. For a Series A company to have that many blue-chip customers is a massive signal of product-market fit. It answers the 'does this work?' question before it can even be asked.
The Analogy Strategy: Comparing the business to Bloomberg and Netflix makes a complex, niche data product immediately understandable to generalist investors. It frames the company as a 'category king' in a previously ignored sector.
The 'Why Now' Urgency: Slide 11 does an excellent job of tying the company's success to unavoidable global events like climate change and government spending. It creates a sense that the window to invest is closing as the 'perfect storm' hits.
What Is Missing
The Team Slide: This is a glaring omission. In a Series A raise, investors are betting as much on the founders' ability to execute as they are on the market. The absence of bios for the leadership team is highly unusual.
Unit Economics and Financials: While the deck mentions a $2.1T market, it provides zero information on the company's actual revenue, growth rate, CAC (Customer Acquisition Cost), or LTV (Lifetime Value). Investors usually require these metrics to justify a $5M check.
Competition: The deck mentions 'legacy data providers' but doesn't name them or provide a feature-by-feature comparison. A competitive matrix would have helped clarify their specific technological advantage over incumbents.
Founder Takeaways
Use analogies to simplify: If you are in a 'boring' or complex industry like infrastructure, use well-known companies (Bloomberg, Netflix) to explain your business model and potential scale. · Front-load your social proof: If you have big-name customers, don't hide them at the end. Citylitics put their logo wall on Slide 5, which immediately builds credibility for the technical claims that follow. · Connect to macro trends: Don't just talk about your software; talk about the world your software lives in. Linking your product to government stimulus or climate change makes your success feel inevitable. · Don't skip the team: While Citylitics succeeded without it in this version of the deck, most founders should include a team slide to highlight domain expertise, especially in a legacy industry where 'who you know' still matters.
Frequently asked questions
- What is the core problem Citylitics is solving?
- Citylitics addresses the inefficiency of the infrastructure market, which traditionally operates on an 'old boys' network' where sales intelligence is shared via human networks. According to Slide 3, legacy data providers deliver stale and inaccurate data, leading to failed projects. The platform aims to provide early-stage 'pre-positioning' data so vendors can find opportunities before the formal RFP stage, which is often too late.
- How does the Citylitics technology work?
- As detailed on Slide 8, the process involves four stages: Aggregation (crawling 30,000+ public sites every two weeks), Categorization (using ML to classify fragmented documents), Extraction (using NLP to pull relevant content), and Curation (delivering data via an intuitive UX). This automated pipeline transforms millions of fragmented public documents into actionable sales leads for engineering and construction firms.
- Who are the primary customers for this platform?
- The platform targets manufacturers, suppliers, engineering, construction, and consulting firms. Slide 5 showcases a diverse roster of over 50 clients, including global giants like Jacobs, DuPont, and ABB, as well as specialized firms like Badger Meter and Xylem. These companies use the data to increase sales efficiency and target infrastructure projects with higher precision.
- What market analogies does Citylitics use to justify its potential?
- Slide 12 compares Citylitics to 'de facto market data platforms' in other sectors. They cite Bloomberg and S&P Capital IQ in Finance, CoStar Group in Real Estate, and ZoomInfo in B2B sales. By showing that these platforms generate between $0.5B and $10B in annual revenue, Citylitics argues that the $2.1T infrastructure sector deserves and will inevitably support a similar ubiquitous data platform.
- What are the 'Mega Trends' driving the business now?
- Slide 11 identifies five converging trends: Trillions in planned government stimulus, extreme infrastructure stress caused by climate change, cities rethinking priorities due to COVID-19, an acceleration in data generation by utilities, and the company's own accelerating growth trajectory. This 'perfect storm' argument is designed to create a sense of urgency for investors.