The Asanko Gold deck from June 2018 is a highly technical, data-driven presentation designed for institutional investors in the natural resources sector. Spanning 17 slides (9 of which are analyzed here), the deck centers on the company's transition to a debt-free status following a joint venture with Gold Fields. It provides granular operational data, including All-In Sustaining Costs (AISC), ore grades, and stripping ratios across multiple pits like Nkran and Dynamite Hill. By projecting a five-year average production of 253,000oz at an AISC of $860/oz, Asanko builds a case for long-term va…
Key takeaways
- The company highlights a 5.1Moz reserve and a 5Mpta CIL processing capacity on slide 3.
- A major transaction rationale on slide 5 emphasizes emerging 'debt free' with a pro forma cash position of approximately $55m.
- Slide 7 details the regional dominance of partner Gold Fields, which produced 710koz in Ghana during 2017.
- Granular mining statistics on slide 9 show a Q1 2018 strip ratio of 15.7:1, significantly higher than previous quarters due to the Nkran Cut 2 pushback.
- Financial performance on slide 11 reveals an AISC of $1,226/oz for Q1 2018, driven by deferred stripping costs of $533/oz.
- Long-term outlook on slide 13 projects gold production to peak at 280,000oz in 2020.
- The capital structure on slide 17 shows 244.3m shares fully diluted with listings on the TSX and NYSE American under 'AKG'.
- Institutional ownership is highly concentrated, with the top 12 shareholders holding significant stakes, led by Zijin at 13.7% (slide 17).
Introduction: The Operational Pivot
The Asanko Gold investor presentation from June 2018 is a technical document released at a critical juncture for the company. Following the announcement of a joint venture with Gold Fields, the company needed to re-establish its value proposition to the public markets. The deck moves away from the 'visionary' style of early-stage startups and instead adopts the rigorous, metric-heavy language of the mining industry. It focuses on reserves, recovery rates, and cost-per-ounce metrics to prove that the company is a viable, long-term producer rather than a speculative explorer.
Slide 1: Title and Positioning
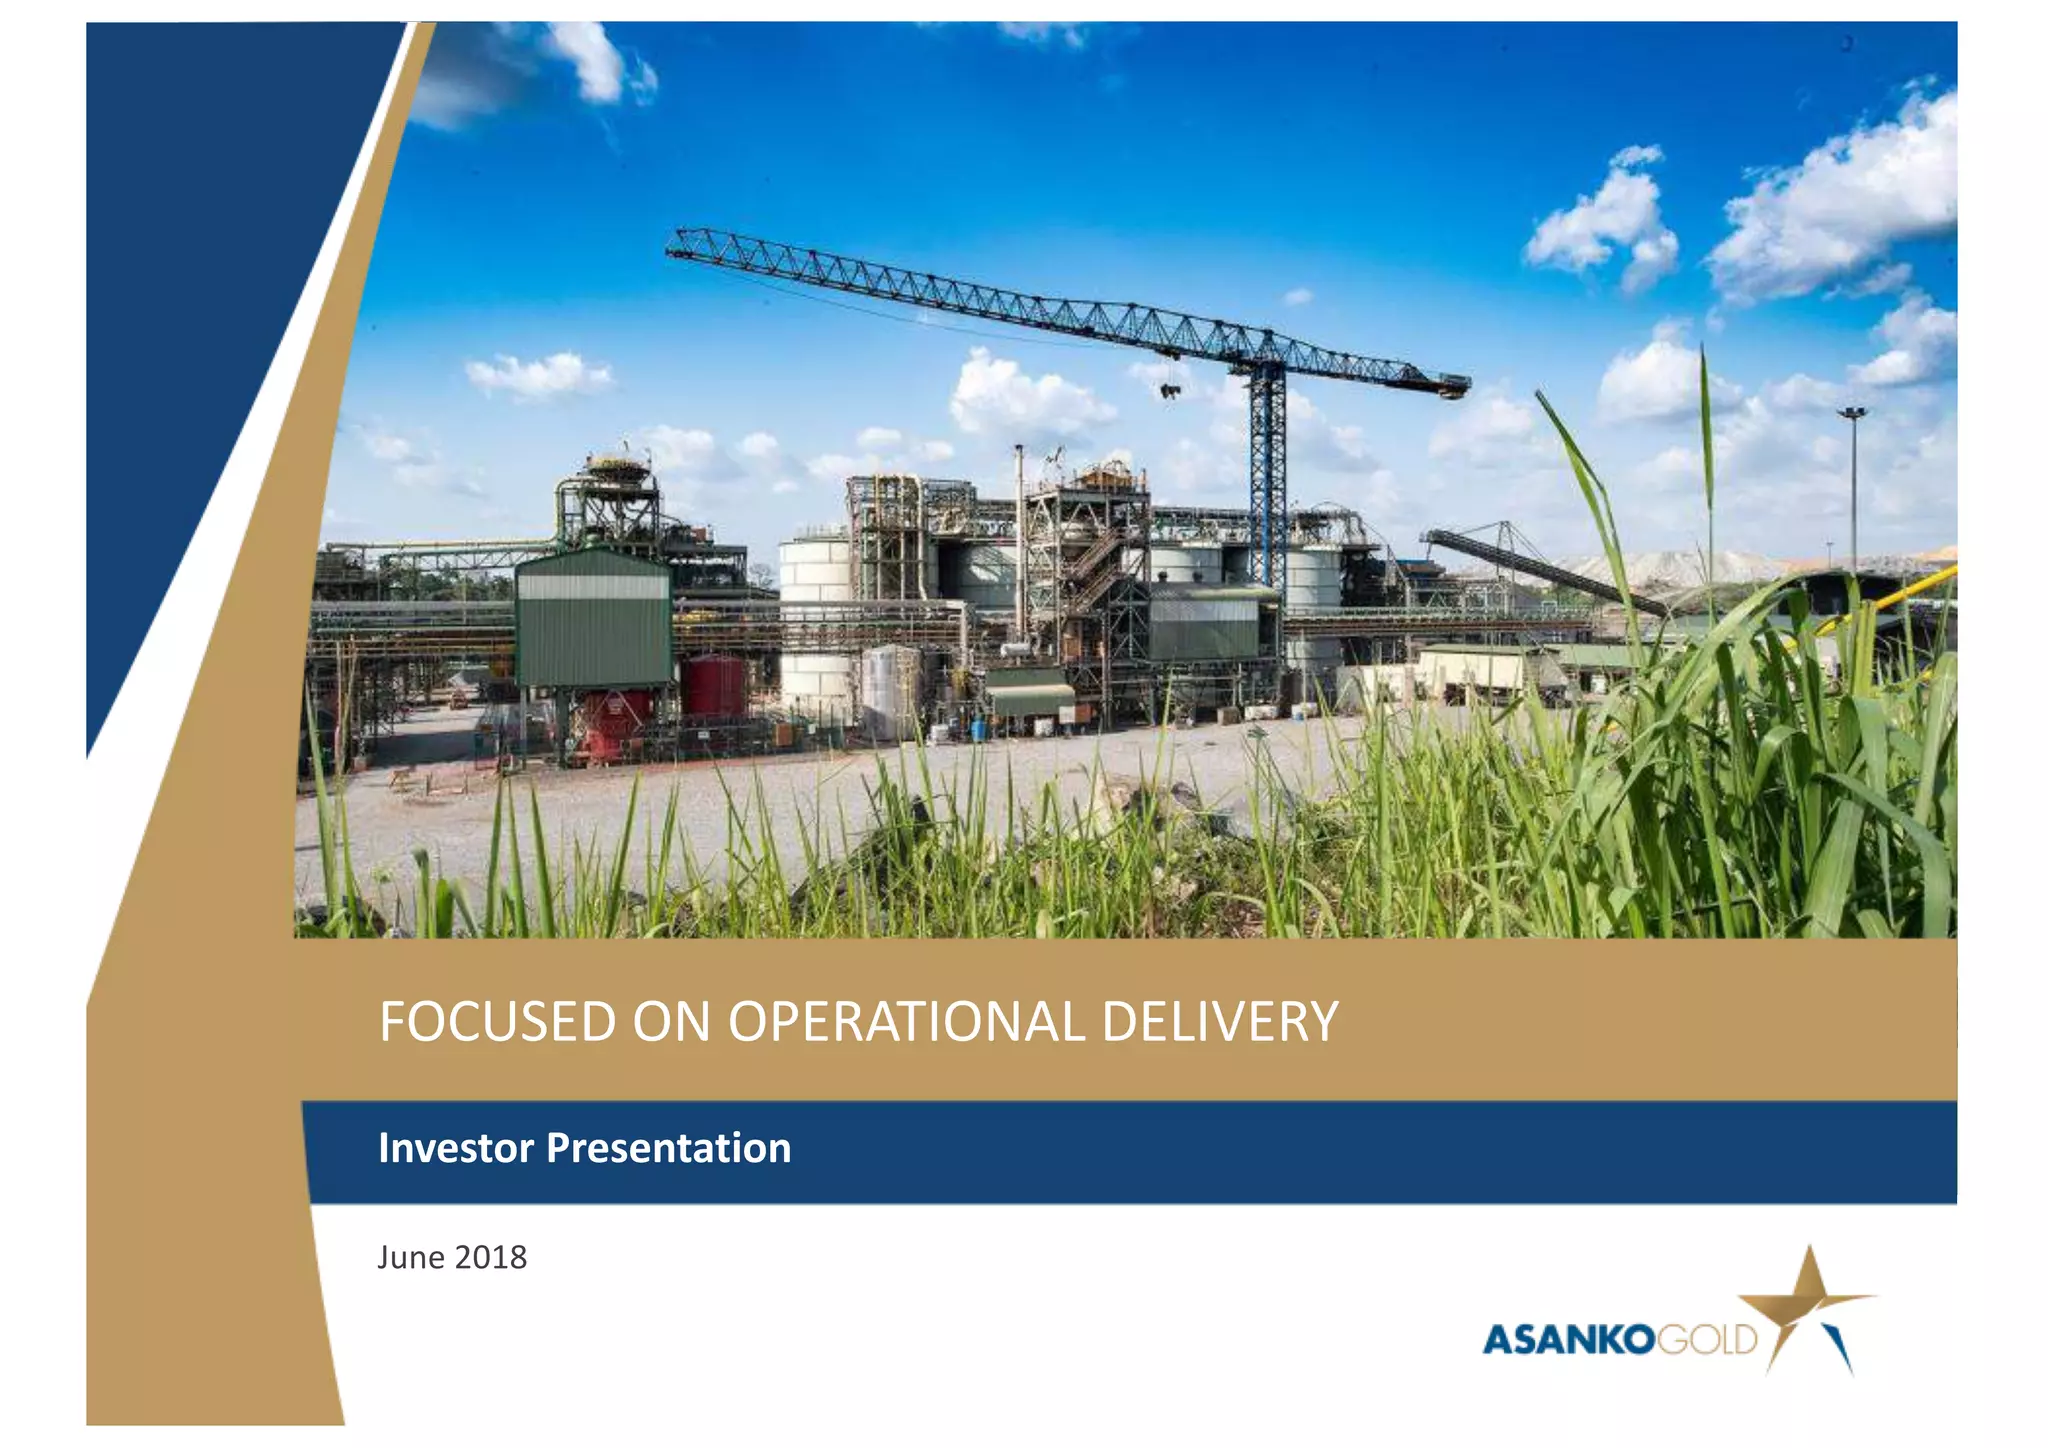
The cover slide features a high-resolution image of the processing plant, immediately signaling that this is an operational company, not a greenfield project. The tagline "FOCUSED ON OPERATIONAL DELIVERY" sets the theme for the entire deck. It is a direct response to market concerns regarding execution risks in mining. The date, June 2018, places this presentation shortly after the Gold Fields transaction announcement, making it a 'trust-building' document.
Slide 3: Asanko at a Glance
This slide serves as the executive summary. It defines the asset as a "Large Scale, Long Life, Multi-Pit Asset" with 11 open pit deposits . Key metrics are stated clearly: 6.6Moz M&I Resources and 5.1Moz Reserves . The 2018 guidance is provided as 200,000 - 220,000oz @ AISC $1,050 - 1,150/oz . The inclusion of a map showing the 5Mtpa CIL plant and the conveyor route to the Esaase deposit provides geographical context for the growth plan. The slide also highlights a "Stable Jurisdiction," noting Ghana's 100-year history of gold mining, which is a standard but necessary inclusion for African mining projects to mitigate perceived geopolitical risk.
Slide 5: Gold Fields Transaction Rationale
This is arguably the most important slide for the 2018 context. It breaks down the benefits of the joint venture into four pillars: Balance Sheet, Partner Experience, Management Endorsement, and Future Growth. The most striking figure is that Asanko emerges "debt free" with a pro forma cash position of approximately US$55m . By citing Gold Fields as the world's 7th largest gold producer, Asanko borrows credibility. The slide explicitly states that the transaction "validates the Asanko Gold Mine from a technical and operational perspective," which is a clear message to skeptics of the mine's geology.
Slide 7: Regional Context and Peer Performance
Slide 7 focuses on the "Gold Fields West Africa Region." It lists the performance of nearby mines: Tarkwa (566koz in 2017) and Damang (144koz in 2017). By showing these figures, Asanko demonstrates that their partner has a proven track record of successful operations in the exact same geological belt. The map shows the proximity of the Asanko Gold Mine to the Damang and Tarkwa mines, reinforcing the idea of a 'mining cluster' with shared infrastructure and labor pools.
Slide 9: Granular Mining Performance
Slide 9 moves into the weeds of operational data. It provides a table of "AGM Key Mining Statistics" comparing Q1 2018 against the three previous quarters. A notable data point is the Strip Ratio , which jumped to 15.7:1 in Q1 2018 from 6.2:1 in Q3 2017. While a high strip ratio is generally negative (more waste moved per unit of ore), the bullet points explain this as a deliberate "enlarged pushback" at the Nkran pit to access higher ore yields in the future. This is a classic example of using data to explain a temporary dip in efficiency as a long-term strategic investment.
Slide 11: Financial Performance and Cost Breakdown
This slide addresses the financial impact of the operational decisions shown on slide 9. The AISC (All-In Sustaining Cost) is reported at $1,226/oz for Q1 2018. The deck is transparent about why this is high, attributing $533/oz to deferred stripping. The slide includes two bar charts: "Cash flow from operations" and "Quarterly EBITDA." Despite the high AISC, the company shows a relatively stable EBITDA, with Q1 2018 at $30,401 (thousands) , slightly above the trailing 4-quarter average. This transparency is designed to prevent investor panic over high headline costs.
Slide 13: The Five-Year Outlook
Slide 13 is the 'forward-looking' value driver. It projects a 5-year average production of 253,000oz @ US$860/oz . The bar chart shows production peaking in 2020 at 280,000oz . Crucially, the table at the bottom shows that Total Capex is expected to drop significantly from $100.5m in 2020 to just $9.0m in 2022 . This tells a story of a capital-intensive period followed by a 'harvest' period of high cash flow. The mention of a ~$US450/oz margin at current gold prices ($1,250/oz) provides a simple shorthand for the company's profitability potential.
Slide 15: The Investment Proposition
This slide summarizes the pitch into four horizontal blocks. It reiterates the "debt free" status and the "world-class partner." It is a standard summary slide, but it effectively ties the technical data back to the core investment thesis: Asanko is a de-risked, well-funded producer with a clear path to organic growth.
Slide 17: Corporate Information and Ownership
The final slide provides the capital structure and shareholder base. With 244.3m shares fully diluted and listings on major exchanges (TSX & NYSE American), the company demonstrates liquidity. The "Top Institutional Shareholders" list is impressive for a mid-tier miner, featuring names like Zijin (13.7%) , Donald Smith (10.0%) , and Ruffer (7.9%) . The ownership pie charts show that 65% of the company is held by institutions, which serves as a final 'social proof' for new investors.
What Works in This Deck
Extreme Transparency: The deck does not hide the high costs of Q1 2018. Instead, it provides the exact dollar-per-ounce breakdown of why those costs occurred (deferred stripping) and when they will normalize. This builds significant trust with sophisticated analysts.
Strategic Alignment: Every slide reinforces the Gold Fields partnership. By constantly referencing the partner's scale and regional success, Asanko mitigates the 'single-asset risk' often associated with mid-tier miners.
Data Density: For a mining deck, the level of detail regarding ore grades, strip ratios, and capex schedules is appropriate. It allows an investor to build their own financial model directly from the slides.
What Is Missing
Management Biographies: In the provided selection of 9 slides, there is no mention of the individuals running the company. While the Gold Fields partnership provides 'corporate' credibility, investors in the mining sector often bet on the 'jockey' (the CEO and COO) as much as the 'horse' (the mine).
Environmental and Social Governance (ESG): While slide 3 mentions a "Strong Social License to Operate" and a "1 year LTI-free" safety record, there is very little detail on community relations, water usage, or environmental reclamation plans, which are increasingly important to institutional investors.
Gold Price Sensitivity: The deck assumes a gold price of $1,250/oz for its margin calculations. A sensitivity analysis showing how the project performs at $1,100 or $1,400 gold would have added another layer of robustness to the financial projections.
What a Founder Should Copy
The 'Rationale' Slide: If you are doing a JV or a major partnership, use the format of Slide 5. It clearly explains why the deal matters for the balance sheet, the operations, and the future growth, rather than just announcing the deal happened.
Visualizing the Timeline: Slide 13's combination of a production bar chart and a cost line graph is the gold standard for showing growth. It allows the viewer to see the inverse relationship between capital expenditure and production output over time.
Shareholder Transparency: Listing your top 10-12 shareholders (Slide 17) is a bold move that signals you have nothing to hide and that you are backed by 'smart money.' If you have reputable investors, show them off in a list, not just a wall of logos.
Frequently asked questions
- What is the primary goal of this investor presentation?
- The primary goal is to communicate the strategic and financial benefits of the joint venture with Gold Fields. It aims to reassure investors by showing a path to becoming debt-free, improving the balance sheet, and securing a world-class partner to fund organic growth at the Esaase deposit.
- How does Asanko Gold justify its high Q1 2018 AISC?
- On slide 11, the company explains that the All-In Sustaining Cost (AISC) rose to $1,226/oz primarily due to the Nkran Cut 2 pushback. This activity accounted for 38% of the total AISC ($467/oz) and led to higher deferred stripping costs. They project these costs to drop as steady-state ore delivery resumes in H2.
- What are the key production targets for the next five years?
- According to slide 13, Asanko targets a 5-year average production of 253,000oz at an AISC of $860/oz. Production is expected to scale from 200,000-220,000oz in 2018 to a peak of 280,000oz in 2020, supported by the development of the Esaase deposit.
- Who are the major shareholders of Asanko Gold?
- Slide 17 lists Zijin as the largest institutional shareholder at 13.7%, followed by Donald Smith at 10.0% and the joint venture partner, Gold Fields, at 9.9%. The ownership is 65% institutional and 23% strategic, indicating a sophisticated investor base.
- What geographical advantage does the company claim?
- Slide 3 emphasizes the 'Stable Jurisdiction' of Ghana, noting it is the longest-functioning democracy in sub-Saharan Africa and ranked 10th globally for gold mining. Slide 7 further reinforces this by showing the proximity of their mines to established infrastructure and other major operations like Tarkwa and Damang.