SandRidge Energy’s June 2017 investor presentation is a quintessential example of a public-market style energy deck, prioritizing geological precision and historical production data over narrative storytelling. The company positions itself as an unlevered oil producer with a $697 million market equity value, focusing on three primary asset clusters: the Mississippian, NW STACK, and Niobrara Shale. The deck relies heavily on technical validation, including cross-section geological diagrams and comparative industry results, to justify its development strategy. While it excels at providing granu…
Key takeaways
- The company identifies as an unlevered oil producer with a market equity value of $697 million as of June 2, 2017 (Slide 3).
- SandRidge manages a total of 597,000 net acres across three primary basins: Mississippian, NW STACK, and Niobrara Shale (Slide 3).
- Geological targeting is specific, focusing on the Meramec and Lower Osage formations at depths ranging from 5,800 to 12,500 feet (Slide 6).
- Production performance in the Niobrara program exceeded the type curve by 11% for the full 2016 program and 20% for crosslinked completions specifically (Slide 15).
- Q1 2017 production was reported at 44.2 MBoepd, with 28% of that volume being oil (Slide 3).
- The company maintains a significant hedging program, with 80% of oil and 77% of gas volumes hedged for the remainder of 2017 (Slide 24).
- Operational costs are transparently disclosed, with Lease Operating Expenses (LOE) at $6.28 per BOE in Q1 2017 (Slide 21).
- The deck utilizes industry benchmarking, showing Osage initial production averages of 700-800 Boepd in surrounding acreage (Slide 9).
Executive Summary: The Technical Asset Play
The SandRidge Energy investor presentation from June 2017 is a data-centric document designed for an audience that understands the nuances of upstream oil and gas operations. Unlike a typical startup deck that sells a vision or a disruptive technology, this deck sells geological probability and operational efficiency. The company positions itself as a stabilized, unlevered player focused on maximizing the value of its 597,000 net acres. The narrative is driven by results—specifically, outperforming production benchmarks and maintaining a disciplined cost structure.
Slide 1: Title and Visual Context
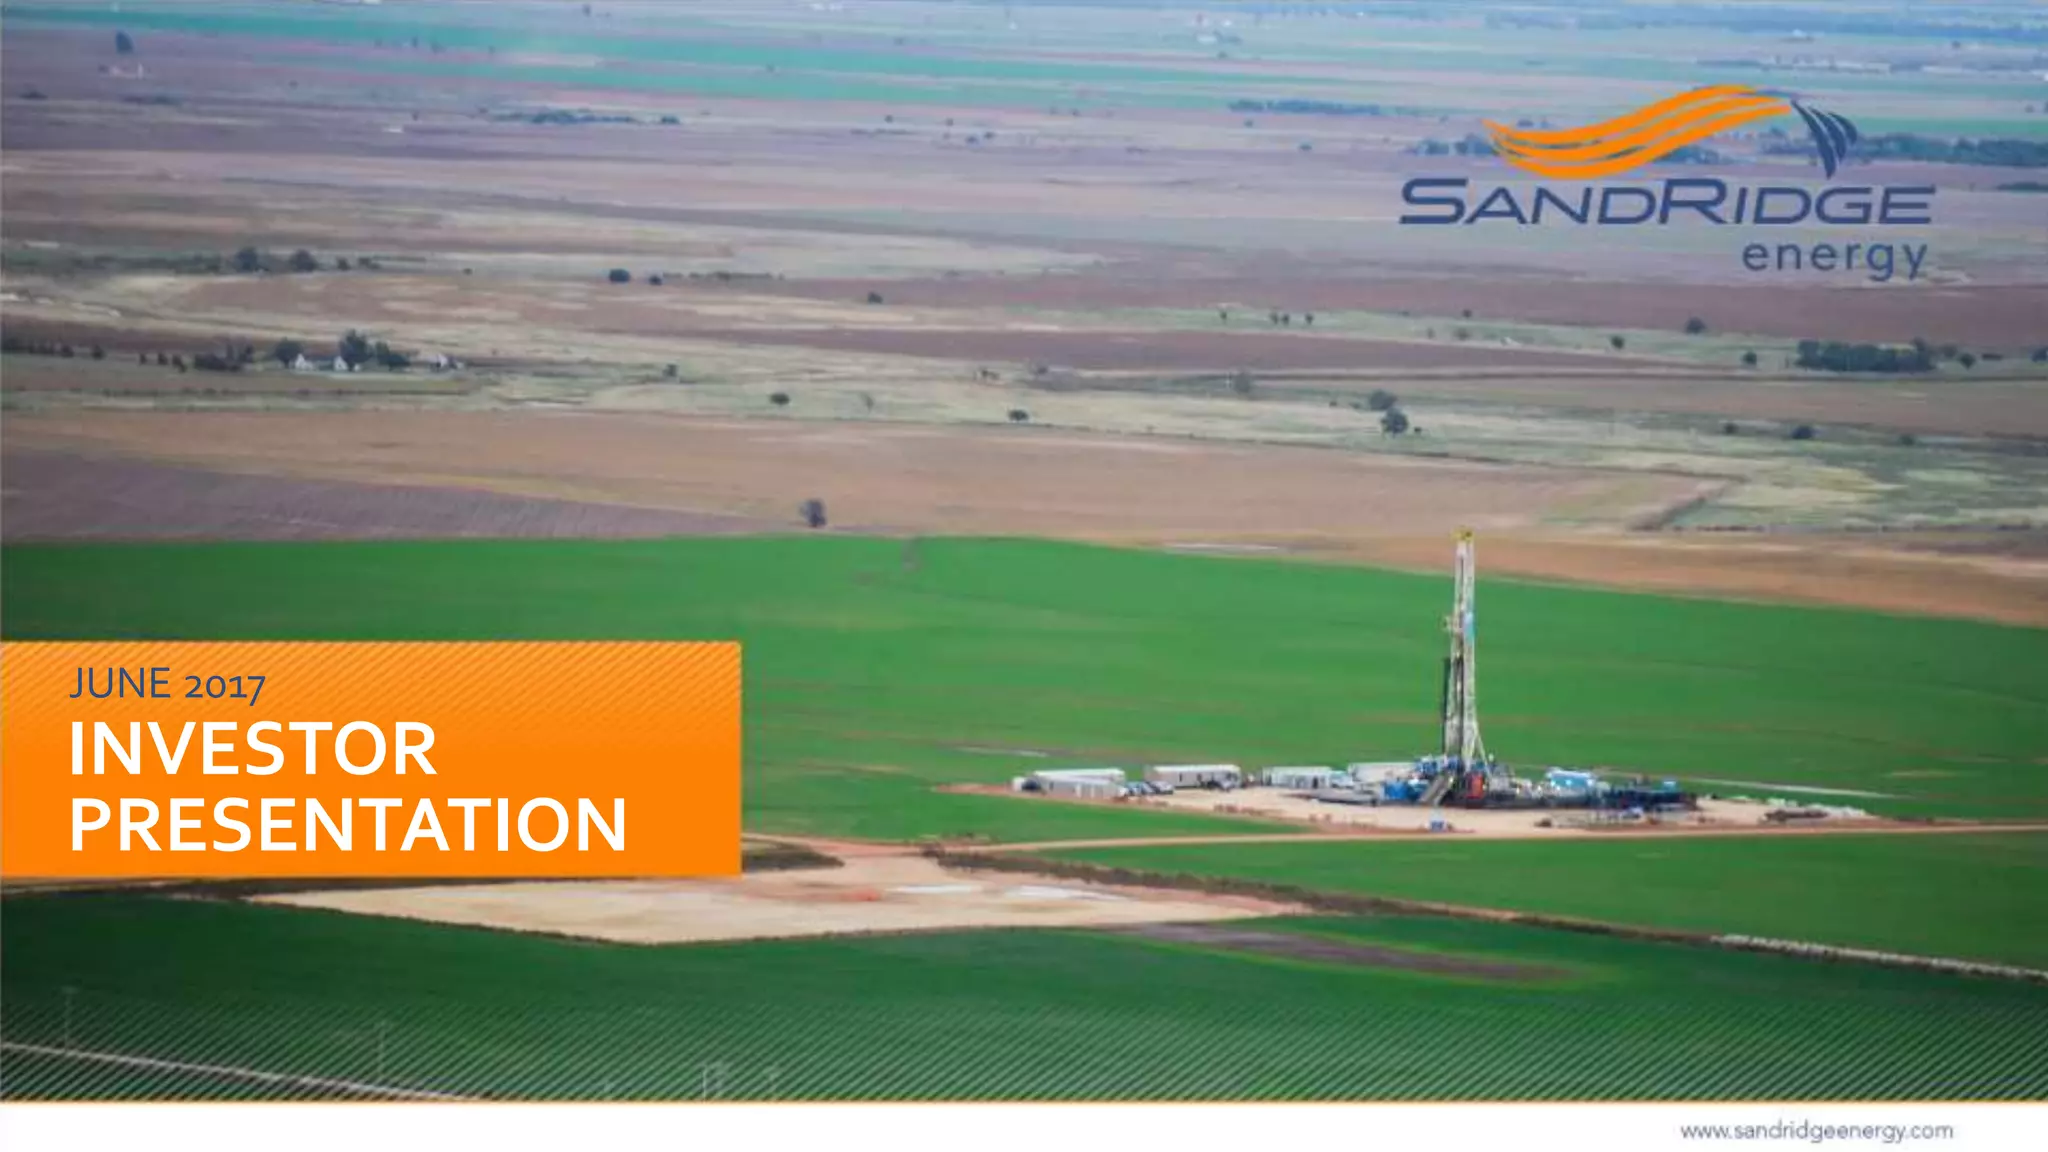
The cover slide features a wide-angle photograph of a drilling rig in a flat, agricultural landscape, establishing the company's operational environment. The branding is clear, featuring the SandRidge Energy logo and the specific date of the presentation (June 2017). The inclusion of the website URL at the bottom suggests this is a public-facing document intended for broad investor consumption.
Slide 3: SandRidge Energy Overview
This is the most critical slide for a high-level understanding of the business. It defines SandRidge as an "Unlevered oil producer focused on resource value creation." Key metrics provided include a market equity value of $697 million and 35.9 million common shares. The slide breaks down the primary assets into three categories: Mississippian (400k net acres), NW STACK (70k net acres), and Niobrara Shale (127k net acres). It also lists Q1 '17 production at 44.2 MBoepd and YE '16 proved reserves at 180 MMBoe with a $763 million PV-10 valuation. This slide effectively establishes the scale and the 'why' of the company's valuation.
Slide 6: NW STACK Primary Targets
Moving into technical specifics, this slide uses a 3D geological cross-section to illustrate the drilling targets in the NW STACK. It identifies the Meramec and Lower Osage formations as the primary targets, noting they are the same productive formations found in the broader STACK play. The slide provides specific depth ranges (5,800’ to 12,500’ TVD) and thickness measurements (50’-160’ for Meramec and 450’-1,300’ for Osage). This level of detail is intended to de-risk the asset for technical analysts by showing a clear understanding of the subsurface geology.
Slide 9: Industry Osage Results
To validate their focus on the Osage formation, SandRidge provides a map of surrounding industry results. The slide states that initial production in the area has averaged 700-800 Boepd with approximately 40% oil. The map is crowded with data points from competing wells (labeled with names like 'Benkendorf', 'Carter', and 'Elwell'), highlighting SandRidge’s acreage in yellow. This comparative data serves as a proof of concept, suggesting that if neighbors are successful, SandRidge's adjacent land holds similar potential.
Slide 12: 2016 Niobrara Program Success
This slide focuses on operational execution in the North Park Basin, Colorado. It highlights 11 laterals drilled in 2016 that outperformed the type curve. Notable achievements include the first 'XRL' (extended reach lateral) in the basin, a 2-mile well completed for $3.4 million with a 30-day initial production (IP) of 901 Boepd. The slide also mentions the first 'C' bench well test. By detailing specific well results and cost reductions, SandRidge demonstrates its ability to innovate and optimize completion designs in real-time.
Slide 15: 2016 Niobrara Oil Production Above Type Curve
This slide uses two charts to visualize production performance against expectations. The left chart shows the total 2016 drilling program exceeding the type curve by 11% (79.5 MBbls vs. 71.9 MBbls). The right chart isolates wells using crosslinked completions, which exceeded the type curve by 20% (86.4 MBbls). This data-driven approach justifies the company's shift toward crosslinked gel fracs over slickwater, providing a clear link between engineering decisions and financial outcomes.
Slide 18: Appendix Divider
A simple visual break featuring a drilling rig against a backdrop of snow-capped mountains. This marks the transition from the core narrative to the supplemental financial and operational data. The high-quality photography reinforces the scale of the company's physical operations.
Slide 21: Four Quarters of Trailing Actuals
This slide provides a dense table of financial and production metrics from Q2 2016 through Q1 2017. It tracks the decline in total production from 54.7 MBoepd to 44.2 MBoepd over the year, while also showing pricing realizations and costs. Notably, Lease Operating Expenses (LOE) dropped from $8.58 per BOE in Q2 '16 to $6.28 in Q1 '17. This transparency regarding both the shrinking production base and the improving cost efficiency is vital for institutional investors modeling the company's cash flow.
Slide 24: Hedging Overview
The final slide in the provided set details the company's risk management strategy. It shows that 80% of oil and 77% of gas volumes for 2017 are hedged. The tables provide quarterly breakdowns of swap volumes and prices through the end of 2018. With oil hedged at $52.24 for 2017 and $55.34 for 2018, the company is signaling to investors that its revenue stream is protected against significant downward swings in commodity prices.
What SandRidge Energy Does Well
The deck is an excellent example of technical transparency. In the energy sector, investors are buying geology and engineering as much as they are buying management. By providing specific TVD (True Vertical Depth) ranges, lateral lengths, and completion types, SandRidge allows investors to perform their own due diligence on the quality of the assets. The use of 'type curves'—the industry standard for expected well performance—and the clear demonstration of outperforming those curves is the strongest persuasive element of the deck. Furthermore, the inclusion of trailing actuals and detailed hedging tables provides a level of financial granularity that builds trust.
What is Missing from the Deck
The most glaring omission is a dedicated 'Team' slide. While this is common for established public companies, an investor presentation should still highlight the leadership responsible for the operational turnarounds described. There is also no explicit 'Ask' or 'Use of Proceeds' slide in the provided selection, though the deck functions more as a general update. Additionally, the deck lacks a clear 'Problem/Solution' framework. It assumes the investor already wants exposure to oil and gas and is simply deciding if SandRidge is the right vehicle. Finally, while the deck mentions being 'unlevered,' it does not provide a full balance sheet or a clear explanation of the company's capital structure post-reorganization, which would be critical for a new investor.
Founder Takeaways: What to Copy
1. Use Benchmarking to Validate Claims: SandRidge doesn't just say their land is good; they show a map of successful wells operated by competitors on adjacent land (Slide 9). If you are in a crowded market, show how your 'neighbors' are succeeding to prove the market exists, then show how you are outperforming them. 2. Data-Driven Optimization: Slide 15 is a masterclass in justifying technical changes. By showing that one specific method (crosslinked completions) outperformed the general program by 9%, they provide a logical path for future capital expenditure. Founders should use data to explain why they are changing their product or strategy. 3. Transparent Unit Economics: The 'Four Quarters of Trailing Actuals' (Slide 21) shows the good and the bad. Production was down, but costs were also down. Being honest about the trends in your business—even the negative ones—builds credibility with sophisticated investors. 4. De-Risking through Hedging: While most startups can't 'hedge' their revenue in the way an oil company can, the principle of showing how you have protected the downside is universal. Whether it's long-term contracts, insurance, or diversified lead sources, showing that you have a plan for market volatility is a sign of mature management.
Frequently asked questions
- What is the primary focus of SandRidge Energy's asset portfolio?
- Based on Slide 3, the company is focused on three primary areas: the Mississippian (400k net acres), the NW STACK (70k net acres), and the Niobrara Shale (127k net acres). The strategy involves harvesting the Mississippian while actively developing the NW STACK and Niobrara assets to increase oil value.
- How does SandRidge validate its drilling performance?
- SandRidge uses 'type curves' as a benchmark for performance. Slide 15 shows that their 2016 drilling program outperformed the 315 Mboe type curve by 11%. Furthermore, by optimizing completion designs—specifically using crosslinked gel instead of slickwater—they achieved production 20% above the type curve.
- What are the company's current production levels and reserves?
- As of Q1 2017, production was 44.2 MBoepd. According to Slide 3, the company's year-end 2016 proved reserves stood at 180 MMBoe (31% oil), with a PV-10 value of $763 million based on strip pricing.
- What is the company's financial health regarding debt?
- The deck explicitly describes SandRidge as an 'unlevered oil producer' on Slide 3. This indicates a capital structure with little to no debt, likely following their 2016 Chapter 11 reorganization, though the reorganization itself is not detailed in these specific slides.
- How does the company protect itself against commodity price volatility?
- Slide 24 details an extensive hedging program. For 2017, they hedged 3.29 MMBbls of oil at a swap price of $52.24 and 32.85 Bcf of natural gas at $3.20. They also have swaps extending into 2018 at slightly higher prices ($55.34 for oil).