The Teranga Gold Corporation deck from December 2014 is a highly technical investor presentation aimed at sophisticated stakeholders in the mining sector. Operating primarily in Senegal, the company outlines a two-phase growth vision to scale production from a 250,000-ounce base case to a 500,000-ounce target. The deck is notable for its heavy reliance on operational data, including specific mill optimization costs ($12M - $15M) and detailed quarterly comparisons of all-in sustaining costs (AISC), which dropped 26% year-over-year to $954/oz in Q3 2014. While the presentation lacks a tradition…
Key takeaways
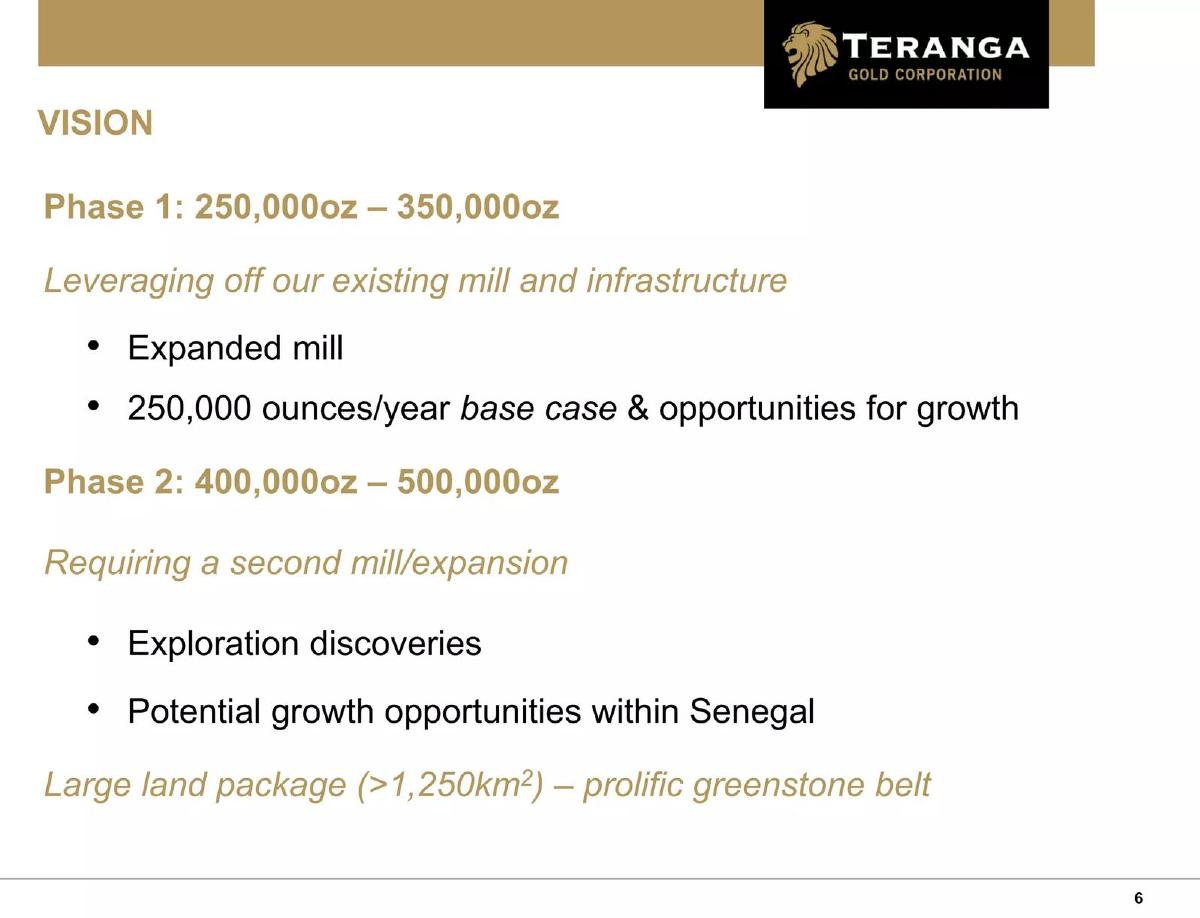
- The company outlines a clear two-phase growth vision, targeting an increase from 250,000 ounces per year to up to 500,000 ounces (Slide 6).
- Mill optimization is a core technical focus, with a projected capital cost of $12M to $15M and an estimated IRR of 30%-60% (Slide 11).
- Operational efficiency is demonstrated by a 26% year-over-year reduction in all-in sustaining costs (AISC) to $954 per ounce in Q3 2014 (Slide 21).
- Social licensing is codified through the Teranga Development Strategy (TDS), focusing on sustainable development, agriculture, and education (Slide 16).
- The Golouma exploration project shows active resource expansion with 7 of 25 drill holes completed as of Q3 2014 (Slide 31).
- A comprehensive Life of Mine (LOM) plan provides production and grade forecasts for nine different pits through the year 2029 (Slide 36).
- The management team is heavily comprised of former Barrick Gold and Gabriel Resources executives, providing significant institutional experience (Slide 46).
- The deck includes a mandatory 'Competent and Qualified Persons Statement' to validate mineral resource estimates under NI 43-101 standards (Slide 41).
Introduction and Strategic Vision
Slide 1: Title Slide
The presentation opens with a high-contrast image of an industrial mining facility at night, branded with the Teranga Gold Corporation logo. It identifies the company as being listed on the TSX and ASX under the ticker TGZ. The primary theme stated is 'FOCUSED,' and the deck is dated December 2014.
Slide 6: Vision
This slide outlines a two-phase growth strategy. Phase 1 targets 250,000oz to 350,000oz of gold production by leveraging the existing mill and infrastructure. Phase 2 aims for 400,000oz to 500,000oz, noting that this will require a second mill or expansion. The company highlights a large land package of over 1,250 square kilometers in a 'prolific greenstone belt' in Senegal.
Operational Optimization and Social Responsibility
Slide 11: Finalizing Mill Optimization
Teranga details technical improvements to the Sabodala mill. The slide includes a scatter plot showing the relationship between crusher throughput and mill rate (tph). Key data points include a design capacity of 3.5 mtpa and a projected 5% to 10% increase in overall throughput through optimization. The total estimated capital cost for these upgrades is cited as $12M - $15M, with an internal rate of return (IRR) of 30%-60%.
Slide 16: Setting Benchmark for Maintaining Strong Social License
This slide addresses the 'Social License to Operate' through the Teranga Development Strategy (TDS). It identifies three priority areas: Sustainable Economic Development, Agriculture and Food Security, and Youth Education and Training. This strategy was the result of an 18-month process involving local, regional, and national stakeholders in Senegal.
Financial and Operational Performance
Slide 21: Operating Highlights
A detailed table compares Q3 2014 performance against Q3 2013. Notable figures include a 273% increase in ounces mined (69,805 oz vs. 18,721 oz) and a 26% reduction in all-in sustaining costs (AISC) from $1,289/oz to $954/oz. The slide also notes that mining began at the Masato pit on schedule, contributing to record throughput.
Slide 26: Q3 Operating Results
This slide provides a more granular breakdown of results for the three and nine months ended September 30. It tracks metrics such as ore mined, waste mined, grade, recovery rate (88.5% in Q3 2014), and gold produced. It also breaks down costs into mining ($3.12/t mined), milling ($15.96/t milled), and G&A ($4.46/t milled).
Exploration and Long-Term Planning
Slide 31: 2014 Golouma Exploration
Teranga showcases a topographic map of the Golouma pit area, highlighting 'Reserve Expansion Potential.' The company reports that 7 of 25 drill holes were completed in Q3, with assays pending. The goal is to step out and infill drill inferred resources to increase reserves to the northwest of the current pit.
Slide 36: Base Case LOM Plan
This is a highly dense data table outlining the Life of Mine (LOM) plan through 2029. It forecasts ore mined, grade, and contained ounces for multiple pits, including Sabodala, Masato, Gora, Golouma, Kerekounda, and Niakafiri. The total contained ounces for the LOM is projected at 2.58 Moz, with an average grade of 1.57 g/t.
Compliance and Leadership
Slide 41: Competent and Qualified Persons Statement
A standard regulatory requirement for mining companies, this slide provides the legal and professional certifications for the technical data presented. It names Ms. Nakai-Lajoie and Mr. Peter Mann as the qualified persons responsible for the resource estimates and exploration results under NI 43-101 and JORC codes.
Slide 46: Management Team
The final slide in this selection introduces the executive team. Richard Young (President & CEO) and several other VPs (Navin Dyal, Kathy Sipos) are noted for their extensive experience at Barrick Gold and Gabriel Resources. The team includes specialists in mining finance, operations, technical services, and stakeholder relations, emphasizing a deep bench of industry veterans.
What Works and What is Missing
What Works: The deck is exceptionally transparent regarding operational costs and technical bottlenecks. By providing the IRR for mill optimization and a year-over-year AISC comparison, Teranga gives investors the exact metrics needed to judge efficiency. The inclusion of a 15-year LOM plan demonstrates long-term viability and strategic planning that goes beyond the current fiscal year.
What is Missing: As a 10-slide subset of a 47-slide deck, several elements are absent here, though they likely exist in the full version. Specifically, there is no slide detailing the gold price sensitivity analysis, which is critical for mining stocks. There is also no explicit 'Ask' or use of proceeds for new capital, as this appears to be a general investor update for a public company rather than a specific fundraising round. Finally, a competitor comparison or market landscape slide is missing from this selection.
Founder Takeaways
Copy the Technical Granularity: For founders in hardware, industrial tech, or energy, this deck is a model for how to present complex operational data. Don't just say you are 'optimizing'; show the scatter plot of throughput vs. capacity and state the expected IRR of the capital expenditure.
Codify Social Impact: Teranga's 'Social License' slide (Slide 16) moves beyond vague ESG claims. By naming a specific 18-month strategy (TDS) and three distinct pillars, they turn a soft metric into a formal business process. Founders in regulated or geographically sensitive industries should adopt this level of formalization for their community impact programs.
Leverage Institutional Pedigree: The management slide (Slide 46) does an excellent job of highlighting 'Barrick Gold' repeatedly. If your team comes from industry giants, ensure that those names are prominent to build immediate credibility in high-stakes sectors like mining or infrastructure.
Frequently asked questions
- What is the primary geographic focus of Teranga Gold?
- The presentation focuses exclusively on Senegal, specifically within a prolific greenstone belt where the company holds a land package exceeding 1,250 square kilometers. The primary operational site mentioned is the Sabodala mill and its surrounding pits, including Masato and Golouma.
- How does the company plan to double its gold production?
- The strategy is divided into two phases. Phase 1 involves leveraging the existing mill and infrastructure to reach 250,000–350,000 ounces. Phase 2 targets 400,000–500,000 ounces, which the company states will require a second mill or a significant expansion driven by new exploration discoveries.
- What technical improvements are being made to the Sabodala mill?
- Teranga is finalizing mill optimization by adjusting SAG and ball mills and the crusher system. The goal is to increase throughput by 5% to 10% by maintaining high crushed stockpiles, as technical analysis shows a direct correlation between stockpile levels and mill rate.
- What are the key financial metrics for Q3 2014?
- In Q3 2014, Teranga reported mining 69,805 ounces of gold at an average realized price of $1,269 per ounce. Total cash costs were $781 per ounce, and all-in sustaining costs (AISC) were $954 per ounce, showing a significant improvement from $1,289 in Q3 2013.
- Who is responsible for the technical data in this presentation?
- The data is compiled and verified by 'Competent Persons' as defined by NI 43-101 and JORC standards. Specifically, Ms. Nakai-Lajoie (P. Geo) and Mr. Peter Mann (FAusIMM) are cited as the qualified professionals overseeing resource estimates and exploration results.