Zynex’s 2015 investor presentation serves as a progress report for a medical device manufacturer navigating a period of significant transition. Operating since 1996, the company highlights a strong foundation in non-invasive electrotherapy (TENS) devices, which accounted for 90% of historical revenue. The deck emphasizes a high-margin profile (>70% gross profit margin) and a recurring revenue model driven by consumable supplies. However, it also candidly illustrates a sharp revenue decline starting in 2013, attributed to the Affordable Healthcare Act and reimbursement changes. The narrative f…
Key takeaways
- The company reports treating more than 280,000 patients since its inception in 1996 (Slide 3).
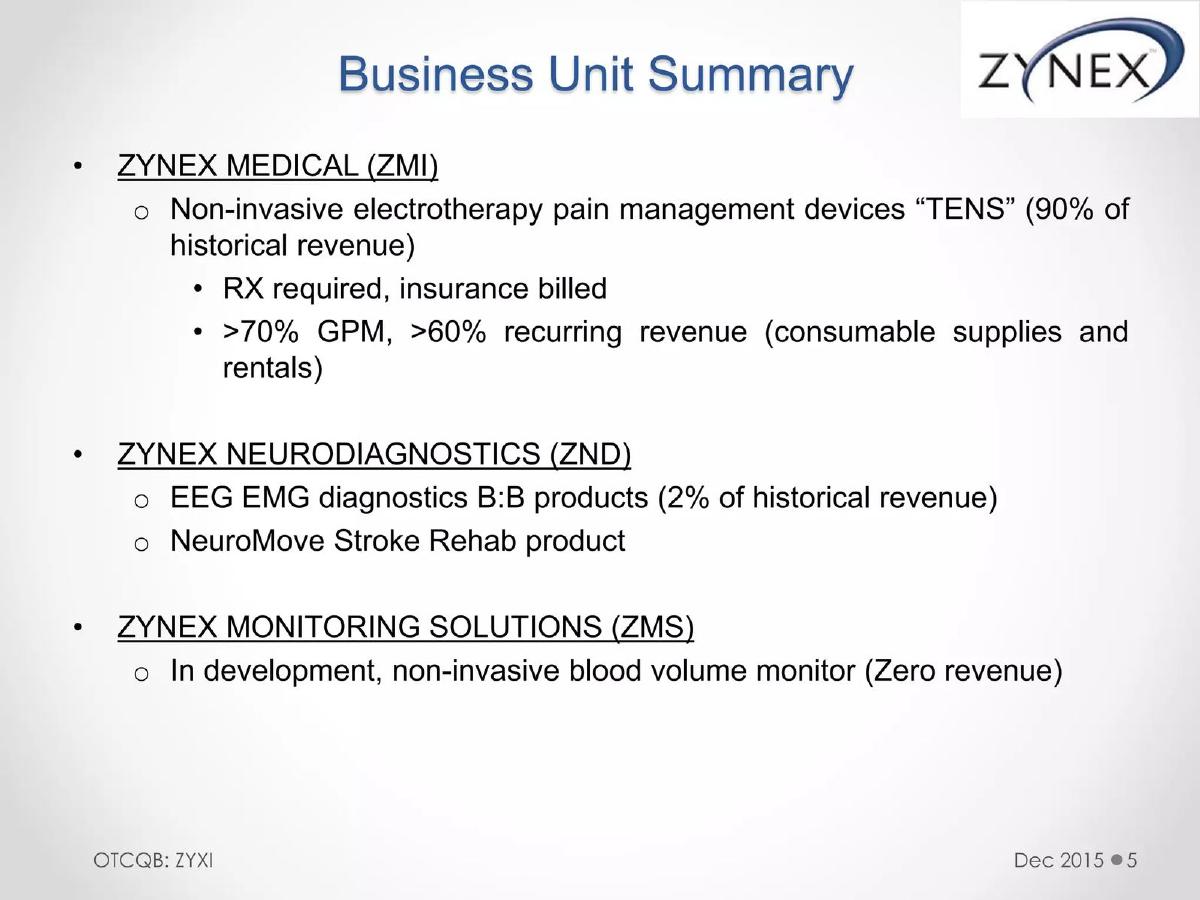
- Zynex Medical (ZMI) generates over 60% recurring revenue through the sale of consumable supplies and rentals (Slide 5).
- Historical revenue peaked in 2012 at approximately $40 million before declining significantly in 2013 and 2014 (Slide 9).
- The balance sheet shows a shift from positive retained earnings of $6,566,000 in 2012 to a deficit of $8,645,000 by September 2015 (Slide 11).
- Management identifies the Affordable Healthcare Act and reimbursement changes as the primary causes for the 2013 business impact (Slide 13).
- A new FDA 510(k) application was filed in September 2015 for the CM1500 blood volume monitoring device (Slide 13).
- Founder and CEO Thomas Sandgaard maintains a majority ownership stake of 57% in the company (Slide 15).
- The company operates with a lean executive team, featuring a founder-CEO and an interim CFO as of late 2015 (Slide 17).
Zynex Investor Presentation: A Deep Dive into Medical Device Recovery
The December 2015 Zynex (OTCQB: ZYXI) investor presentation is a document defined by transparency and the challenges of regulatory shifts. Unlike many startup decks that project purely upward trajectories, Zynex provides a sobering look at how external policy changes—specifically the Affordable Healthcare Act—can disrupt an established medical device business. With a history dating back to 1996, the company uses this deck to argue that its period of decline has bottomed out and that new market opportunities and product clearances are paving the way for a return to growth.
Slide 1: Title Slide
The presentation opens with the Zynex logo and the company's ticker symbol, OTCQB: ZYXI . The design is minimalist, focusing entirely on the corporate identity and its status as a publicly traded entity on the venture market. There is no tagline or mission statement on this slide, suggesting a target audience of institutional or sophisticated retail investors who are already familiar with the sector.
Slide 3: Zynex Overview
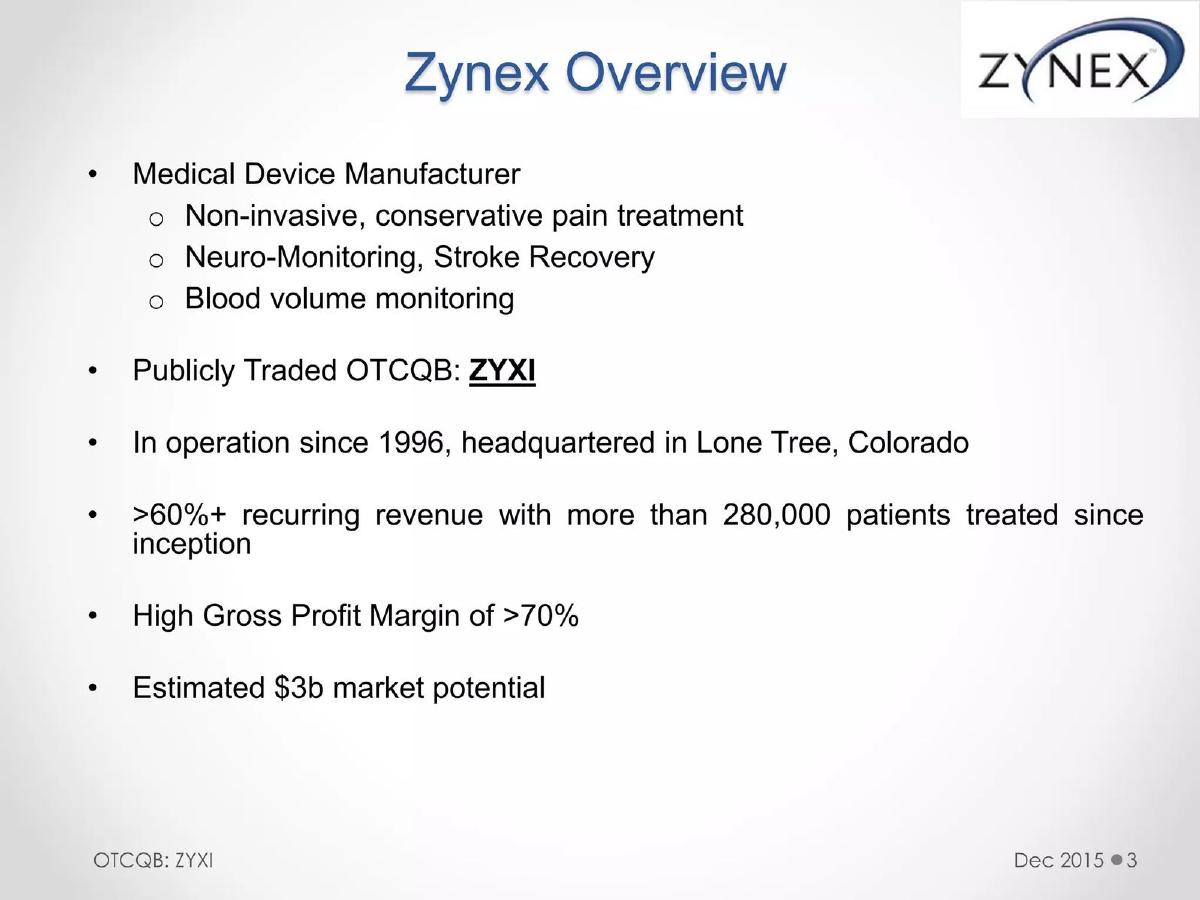
This slide serves as the 'Executive Summary.' It establishes Zynex as a medical device manufacturer specializing in non-invasive, conservative pain treatment , neuro-monitoring, stroke recovery, and blood volume monitoring. Key highlights include:
Longevity: In operation since 1996, headquartered in Lone Tree, Colorado. · Scale: Over 280,000 patients treated since inception. · Business Model: Greater than 60% recurring revenue and a high gross profit margin of over 70%. · Market Size: An estimated $3 billion market potential.
This slide effectively communicates the company's value proposition: a high-margin, recurring revenue business with a long track record and significant room for expansion.
Slide 5: Business Unit Summary
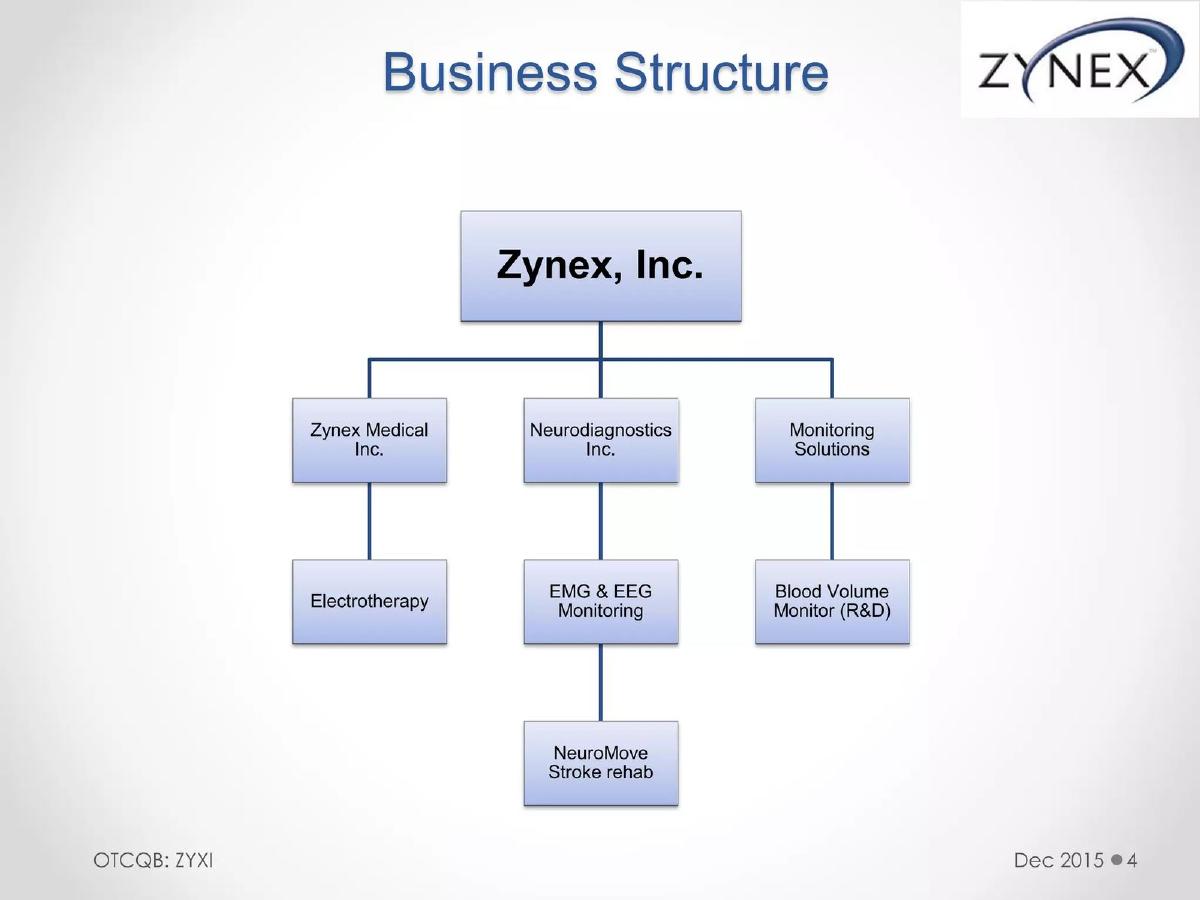
Zynex breaks its operations into three distinct units, providing a clear view of where the money comes from and where future bets are placed:
Zynex Medical (ZMI): The core business, producing TENS (electrotherapy) devices. This unit accounts for 90% of historical revenue . It requires a prescription and is insurance-billed. The recurring revenue comes from consumable supplies (electrodes) and device rentals. · Zynex NeuroDiagnostics (ZND): Focuses on EEG and EMG diagnostics. This is a B2B play that currently represents only 2% of historical revenue, including the NeuroMove stroke rehab product. · Zynex Monitoring Solutions (ZMS): The R&D arm. It is currently in development of a non-invasive blood volume monitor and is generating zero revenue at the time of the presentation.
The distinction between the 'cash cow' (ZMI) and the 'growth bets' (ZND and ZMS) is vital for investors to understand the company's risk profile.
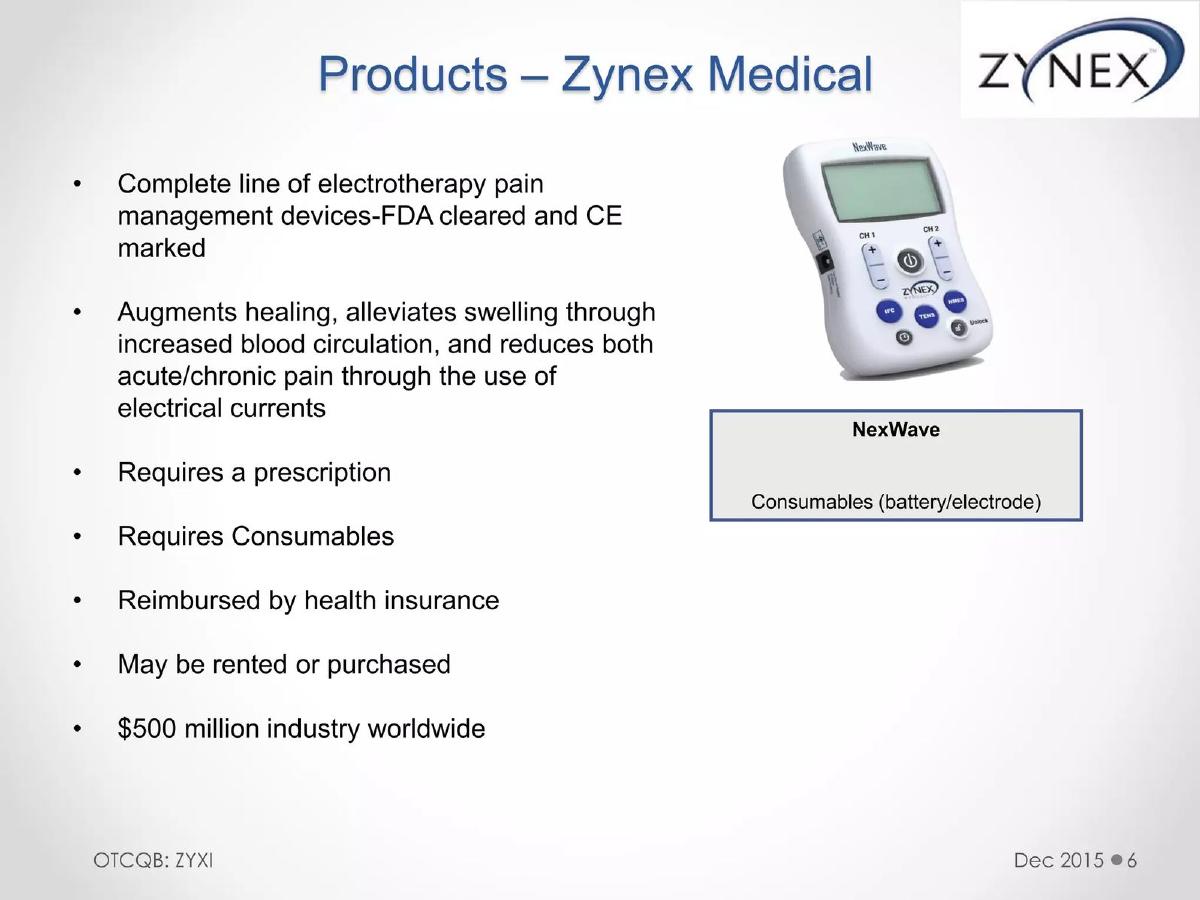
Slide 7: Products – Zynex Medical
This slide focuses on the NeuroMove device. It is described as an FDA-cleared and CE-marked device for stroke and spinal cord rehabilitation. The slide lists its functions: augmenting healing, assisting in recovery for Traumatic Brain Injury, retraining muscles, and increasing range of motion. Crucially, it notes that consumables (electrodes) are required , reinforcing the recurring revenue model mentioned earlier.
Slide 9: Revenue Growth
Slide 9 is perhaps the most honest slide in the deck. It features a bar chart showing annual revenue from 2004 through the first nine months of 2015. The chart shows steady growth from 2004, peaking at approximately $40 million in 2012 . However, it shows a precipitous drop in 2013 and 2014, with 2015 projected to be even lower based on the 9-month data ($9 million for the period ended 09/30/15). This visualizes the 'impact' mentioned later in the deck and sets the stage for the 'recovery' narrative.
Slide 11: Balance Sheet
The balance sheet provides a five-year comparison (2011–2015). It reveals a company in financial distress:
Cash: Dropped from $789,000 in 2011 to just $41,000 in September 2015. · Retained Earnings: Swung from a positive $5,013,000 in 2011 to a deficit of $8,645,000 in 2015. · Total Stockholder Equity: Became negative in 2014 (-$1,267,000) and worsened to -$2,929,000 by late 2015.
The inclusion of this data is a requirement for a public company, but its placement in a pitch deck shows a commitment to providing investors with the full picture of the company's capital needs.
Slide 13: Current Business Factors
This slide explains the 'why' behind the numbers on Slide 9 and 11. It attributes the 2013 decline to the Affordable Healthcare Act and reimbursement changes . However, it offers two major catalysts for a turnaround:
Competitor Exit: A major player, EMPI, announced its exit from the TENS market in November 2015. Zynex plans to recruit their sales reps and capture their customers. · New Product: The CM1500 blood volume monitor filed for FDA 510(k) clearance in September 2015. This device monitors fluid levels and blood loss during surgery.
Slide 15: Corporate & Ownership Structure
A pie chart shows that Thomas Sandgaard (Founder & CEO) owns 57% of the company, while the float is 43%. It lists the common stock outstanding at 31,271,234 shares. It also identifies the company's professional service providers: GHP Horwath as auditors and Burns, Figa and Will as counsel. This slide establishes the governance and capital structure of the entity.
Slide 17: Management Team Bio
Thomas Sandgaard (Chairman, President, CEO): Founder since 1996 with a background at ITT, Siemens, and Philips. He holds an MBA and an electronics engineering degree. · Paul Oberman (Interim CFO): Joined in October 2015. He is a partner at C Squared Solutions with 40 years of experience, including stints at Deloitte & Touche and KPMG.
The 'interim' status of the CFO suggests a company in the middle of a management reorganization or one that is keeping costs low during a lean period.
Slide 19: Stock Symbol
The presentation concludes as it began, with a simple slide displaying the ticker symbol: ZYXI . There is no 'Ask' slide, no 'Use of Proceeds,' and no 'Contact Us' information on the final slide, which is a significant omission for a fundraising document, though typical for a general investor update.
What Zynex Does Well
Zynex excels at financial transparency . By including a multi-year balance sheet and a revenue chart that clearly shows a massive decline, they build trust. They don't try to hide the fact that the business was hit hard by regulatory changes; instead, they lean into the explanation and provide a logical path forward. The breakdown of business units (Slide 5) is also excellent, as it allows investors to value the 'legacy' business separately from the 'speculative' R&D projects.
What is Missing from the Deck
The most glaring omission is a specific 'Ask' or 'Call to Action.' While the balance sheet shows a desperate need for cash ($41k on hand), the deck never explicitly states how much capital they are looking to raise or what the terms might be. Additionally, there is no competitive landscape slide beyond the mention of EMPI's exit. A broader view of who else remains in the TENS or neuro-monitoring space would help investors understand the 'moat' Zynex claims to have. Finally, the product roadmap is vague; we know the CM1500 was filed with the FDA, but we don't know the expected timeline for approval or the commercialization strategy for the ZND unit.
What a Founder Should Copy
Founders should emulate Zynex's unit economics and revenue mix reporting . Stating that 60% of revenue is recurring and 90% comes from a specific product line gives investors a clear 'anchor' for their valuation. Furthermore, the way Zynex identifies a market catalyst (a competitor exiting the market) is a masterclass in turning a threat into an opportunity. If a major player leaves your space, that should be a headline in your deck, as it represents 'low-hanging fruit' for customer acquisition.
Final Analyst Thoughts
The Zynex deck is a 'turnaround story' document. It is not a deck for a company in its honeymoon phase; it is a deck for a company that has survived a near-death experience and is looking for the capital to capitalize on a competitor's failure. The strength of the 70% gross margins and the recurring nature of the electrode sales are the 'hero' metrics here. However, the negative equity and dwindling cash reserves shown on the balance sheet make this a high-risk proposition that requires a very specific type of distressed-debt or turnaround equity investor.
Frequently asked questions
- What is Zynex's primary revenue driver according to the deck?
- Zynex Medical (ZMI) is the primary driver, specifically its non-invasive electrotherapy pain management devices, known as TENS. According to slide 5, these devices represent 90% of the company's historical revenue. The business model relies on prescriptions (RX required) and insurance billing, with a significant portion of income (>60%) coming from recurring sales of consumable electrodes and device rentals.
- How did the Affordable Healthcare Act impact Zynex's financials?
- Slide 13 explicitly states that the TENS business was impacted in 2013 due to the implementation of the Affordable Healthcare Act and subsequent changes in medical reimbursement. This is reflected in the revenue growth chart on slide 9, which shows a steep drop from nearly $40 million in 2012 to roughly $22 million in 2013, continuing to decline into 2014.
- What is the company's strategy for recovery and growth?
- The strategy is two-fold: capturing market share and product diversification. Slide 13 notes that a competitor, EMPI, announced its exit from the TENS market in November 2015, allowing Zynex to recruit their top sales reps and service their customers. Additionally, the company is moving into neuro-monitoring with the CM1500 device, for which an FDA 510(k) application was filed in late 2015.
- What does the ownership structure look like for ZYXI?
- As shown on slide 15, the company has a concentrated ownership structure. Founder and CEO Thomas Sandgaard owns 57% of the company. The remaining 43% is considered 'float,' available for public trading. The slide also notes there are 31,271,234 shares of common stock outstanding and lists GHP Horwath as the company's auditors.
- What are the key financial health indicators mentioned?
- The deck shows a company in a tight cash position. Slide 11 (Balance Sheet) reports only $41,000 in cash as of September 30, 2015, compared to $789,000 in 2011. Total liabilities ($7.9M) exceed current assets ($3.9M), and the company reports a total stockholder equity deficit of -$2,929,000 for the same period, indicating significant financial pressure during their transition phase.