The 2017 evvnt pitch deck is a metrics-driven presentation for an on-demand event marketing platform. The company positions itself as a 'Submit Once' solution that syndicates event data across tickets, emails, social posts, and targeted publishers. The deck is anchored by strong financial performance, reporting $1.2 million in 2016 revenue and a lean team of 10 staff maintaining 89% software margins. While the market size slide uses broad Forrester data to claim a $58 billion TAM, the traction slide provides concrete evidence of growth, showing a jump to over 60,000 events promoted per annum…
Key takeaways
- The company reported $1.2m in revenue for 2016 with a lean team of 10 full-time staff (Slide 5).
- Software margins are stated at 89%, indicating a highly scalable and efficient cost structure (Slide 5).
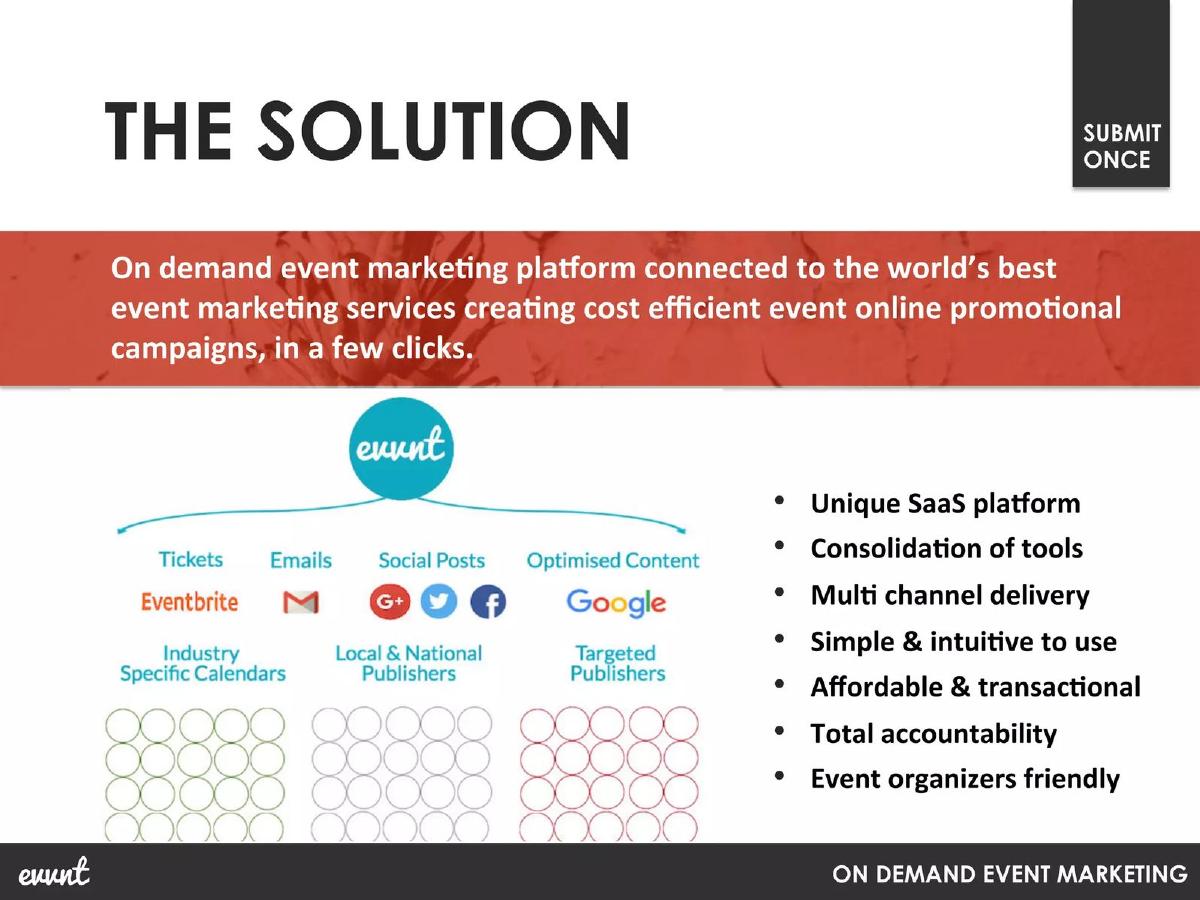
- The platform uses a 'Submit Once' model to distribute content across Eventbrite, Google, and various local/national publishers (Slide 3).
- Traction shows significant growth in events promoted, rising from near zero in 2012 to over 60,000 YTD in 2017 (Slide 5).
- The Total Addressable Market (TAM) is calculated at $58 billion per annum based on global event spending (Slide 4).
- The company aims to reach $16m in revenue by 2020 and achieve a $100m+ valuation within four years (Slide 7).
- The team includes advisors with experience from major platforms like Facebook and Live Nation (Slide 8).
- The deck lacks a specific 'Ask' slide detailing the amount of capital being raised or the valuation terms (Omitted in provided slides).
Executive Summary: The Efficiency of Automated Syndication
The 2017 evvnt pitch deck is a masterclass in presenting a high-margin SaaS business. By focusing on the 'Submit Once' philosophy, the company addresses a clear pain point in the fragmented event marketing industry: the labor-intensive process of listing events on multiple platforms. The deck is lean, data-heavy, and focused on the scalability of their technology. With 89% margins and a clear path to $16m in revenue, the narrative is built around operational efficiency and market dominance through distribution.
Slide 1: Title and Positioning
The cover slide features the brand name 'evvnt' in a stylized script font over a high-energy lifestyle photograph. The subtitle, "INVEST IN THE FUTURE OF SUCCESSFUL EVENT MARKETING," immediately sets the tone for a fundraising conversation. It explicitly states "FUNDRAISING | 2017," ensuring the viewer knows the context of the document from the outset. The red and white color palette is bold and professional.
Slide 2: Mission and Category Definition
Slide 2 defines the company's purpose: "To become the greatest place to promote an event online." It further clarifies the mission as helping people both "promote and find events." Crucially, it anchors the company in the "Marketing Technology - MarTech" sector. This is a strategic move to ensure investors categorize them as a scalable tech play rather than a service-heavy agency. The 'Submit Once' badge appears in the top right corner, a recurring element that reinforces their core product value.
Slide 3: The Solution and Multi-Channel Delivery
This slide explains the mechanics of the platform. It is described as an "On demand event marketing platform connected to the world’s best event marketing services." A diagram shows evvnt at the top, flowing down into four categories: Tickets (Eventbrite), Emails (Gmail icon), Social Posts (G+, Twitter, Facebook), and Optimised Content (Google). Below these are grids representing "Industry Specific Calendars," "Local & National Publishers," and "Targeted Publishers." The right side of the slide lists key attributes, including "Consolidation of tools," "Total accountability," and "Affordable & transactional."
Slide 4: Market Size and Top-Down TAM
Slide 4 uses a top-down approach to market sizing, citing a "$500 billion being spent on events and conferences annually" according to Forrester Research. They estimate that 20% of this is assigned to marketing budgets. The slide breaks down the "Addressable market" as follows:
Total English Speaking (30%): $17 Billion · Of which USA (17%): $10 Billion · Of which UK (1.4%): $800 Million
The final "Total addressable market" is highlighted in a large black circle as "$58 billion p.a." While these numbers are massive, the slide provides citations from Frost & Sullivan and AdAge to lend credibility to the figures.
Slide 5: Traction and Unit Economics
This is arguably the strongest slide in the deck. It opens with a bold statement: "A company with $1.2m in revenues for 2016, offices in London, 10 full time members of staff, 89% margin on software." It also claims "over 300% events promoted growth quarter on quarter." Two bar charts visualize this growth:
Sign Ups & Users (Cumulative): Shows a consistent upward curve from Q3 2012 to Q2 2017, ending at approximately 24,000 users. · Events Promoted Per Annum (Non-cumulative): Shows a dramatic spike in 2017 YTD, already surpassing 60,000 events, compared to roughly 35,000 in all of 2016.
The combination of high margins and accelerating volume is a powerful signal of product-market fit and operational leverage.
Slide 6: Social Proof and Partnership Validation
Slide 6 is a dedicated testimonial slide. It features a quote from James Moore – SVP of Global Partnerships at Web.com : "Time sensitive content such as events are fast becoming a key differentiator in the local information race, and evvnt is well placed to make a major impact in this exciting space." Using a quote from a senior executive at a major digital marketing firm like Web.com serves as significant third-party validation of evvnt's strategic importance in the local search ecosystem.
Slide 7: Timeline and Exit Strategy
This slide outlines the roadmap for the next three years. For 2017 , the goals are to "Double sales team" and "Launch publisher tools." In 2018 , the focus shifts to "Revenue geographical diversification" and launching two new services. By 2019 , they aim for "1m event submissions" and "$8m revenues," with a projection of "$16m in 2020." The slide concludes with a definitive exit goal: "Investment to create a $100m+ events media & marketing company in 4 years." This gives investors a clear target for their potential ROI.
Slide 8: The Team and Advisory Board
The final slide in the provided set introduces the people behind the company. It is divided into three rows:
MGTS (Management): Includes Richard Green (CEO & Founder), Sacha Sebbah (CFO), Kent Daniels (CEO - Middle East), and Philip Lardi (Head of Product). · TECH: Lists Robert Salesas (CTO), Magdalena Bogdal (Technology Lead), and two Senior Developers. · ADVISOR: This row adds significant weight, featuring Tim Chambers (Former Live Nation), Lee McCabe (Former Facebook), Colin Nunn (Finance Director), and Mark Unsworth (Former 7Digital).
The inclusion of 'Former Facebook' and 'Former Live Nation' advisors is a strategic choice to show the company has the right industry connections to scale globally.
What Works in This Deck
Transparency of Margins: Stating an 89% software margin is a bold and effective way to demonstrate the profitability of the business model. It tells investors that for every dollar of revenue, very little is lost to COGS, making it an ideal candidate for venture scale.
Clarity of the 'Submit Once' Value: The deck successfully distills a complex syndication engine into a simple, repeatable slogan. By placing the 'Submit Once' badge on almost every slide, they ensure the investor remembers the core utility of the product.
Strong Traction Visuals: The bar charts on Slide 5 are clear and show a distinct 'hockey stick' inflection point in 2017. Showing non-cumulative event growth alongside cumulative user growth prevents the data from looking artificially inflated.
What Is Missing From This Deck
The Specific Ask: While the deck is labeled 'Fundraising', the provided slides do not include a specific 'Ask' slide. We don't know how much capital they are seeking, what the valuation is, or specifically how the funds will be allocated beyond 'doubling the sales team.'
Competitor Analysis: There is no mention of competitors like Eventful, Spoke, or local listing services. Investors would want to know how evvnt protects its 89% margins against incumbents or new entrants in the MarTech space.
Unit Economics (CAC/LTV): While the overall margin is stated, the deck lacks detail on Customer Acquisition Cost (CAC) and Lifetime Value (LTV). For a SaaS company aiming to double its sales team, understanding the payback period on that investment is critical.
Founder Takeaways: What to Copy
Focus on the 'Why Now': The testimonial from Web.com (Slide 6) perfectly captures the 'Why Now'—the race for local information. Founders should always include a slide that explains why their specific niche is becoming more valuable at this exact moment in time.
Lead with Revenue and Efficiency: If you have $1.2m in revenue and a small team, put that front and center. evvnt doesn't hide their financials; they use their lean headcount as a badge of honor to prove the efficiency of their software.
Visualizing the Ecosystem: The diagram on Slide 3 is an excellent way to show how a platform sits in the middle of a complex ecosystem. Instead of listing features, they show the flow of data from the user to the end-publisher, which is much easier for an investor to visualize.
Project a Clear Exit: Many founders are afraid to talk about the exit. evvnt is explicit: they want to be a $100m company in four years. This alignment of expectations between founder and investor is crucial for a successful round.
Frequently asked questions
- What is evvnt's primary value proposition?
- Based on Slide 3, evvnt acts as a central hub for event organizers. By submitting event details once, the platform automates distribution across multiple channels including ticketing sites (Eventbrite), social media (G+, Twitter, Facebook), search engines (Google), and a network of local and national publishers. The goal is to create cost-efficient promotional campaigns with 'a few clicks.'
- How does the company justify its market size?
- Slide 4 cites Forrester Research stating $500 billion is spent on events annually, with 20% assigned to marketing budgets. They narrow this down to a $58 billion TAM, specifically highlighting the US market at $10 billion and the UK at $800 million. This top-down approach focuses on the 'Total English Speaking' market as their primary target.
- What do the traction metrics reveal about their growth?
- Slide 5 shows two key growth indicators: cumulative sign-ups/users and non-cumulative events promoted per annum. Sign-ups show steady quarterly growth from Q3 2012 to Q2 2017, reaching nearly 25,000. More importantly, the volume of events promoted surged from roughly 35,000 in 2016 to over 60,000 in just the first part of 2017, representing 300% growth.
- What is the long-term financial goal stated in the deck?
- According to the 'Timeline & Exit' on Slide 7, evvnt projected reaching $8 million in revenue by 2019 and $16 million by 2020. The ultimate objective stated is to leverage this investment to build a company valued at over $100 million within a four-year window, focusing on geographical diversification and new service launches.
- Who is behind the company?
- Slide 8 lists a 12-person team divided into Management, Tech, and Advisors. Key figures include Richard Green (CEO & Founder) and Sacha Sebbah (CFO). The technical team is led by CTO Robert Salesas. Notably, their advisory board features individuals formerly of Live Nation, Facebook, and 7Digital, providing significant industry credibility.