The Grow Aquaponics deck is a rare example of a pitch that prioritizes operational math over narrative fluff. Spanning 10 slides, the presentation details a four-phase expansion plan from 3,000 to 45,000 square feet. It provides exact capital expenditure (CAPEX) requirements, such as Rs. 1,61,62,375 for a full acre, and projected returns on investment (ROI) reaching 68% by Year V. While the deck succeeds in demonstrating the efficiency of aquaponics—citing 98% water savings and 6x yield increases—it suffers from significant omissions. There is no mention of the founding team, no competitive a…
Key takeaways
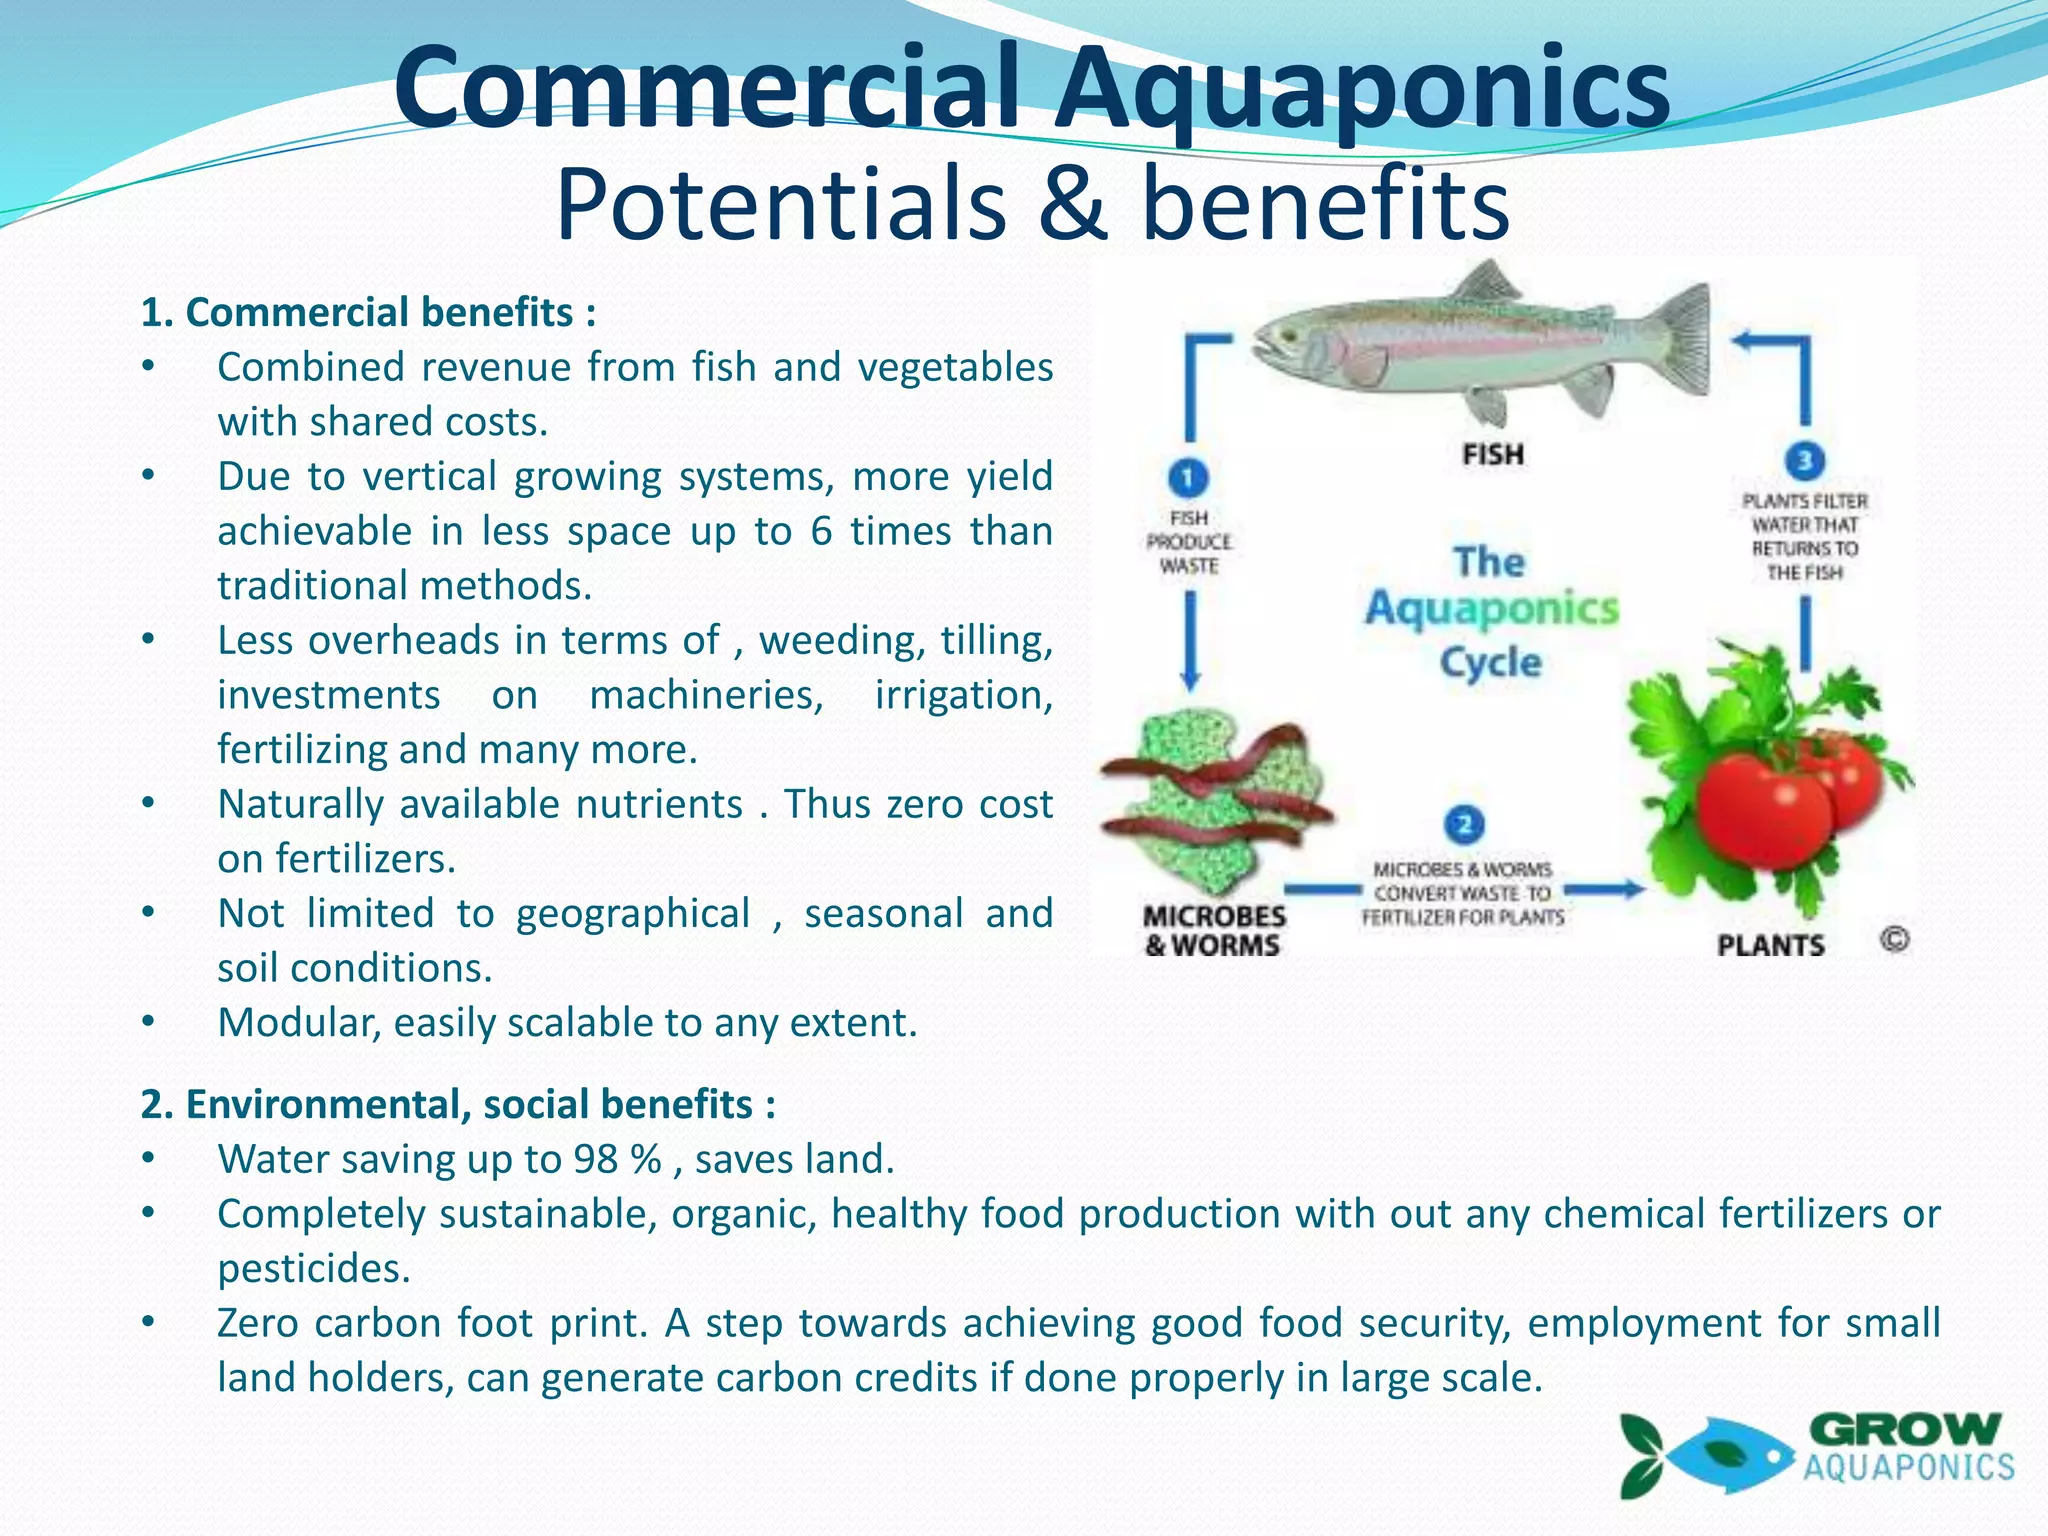
- The company claims aquaponics achieves up to 6 times the yield of traditional methods in less space (Slide 1).
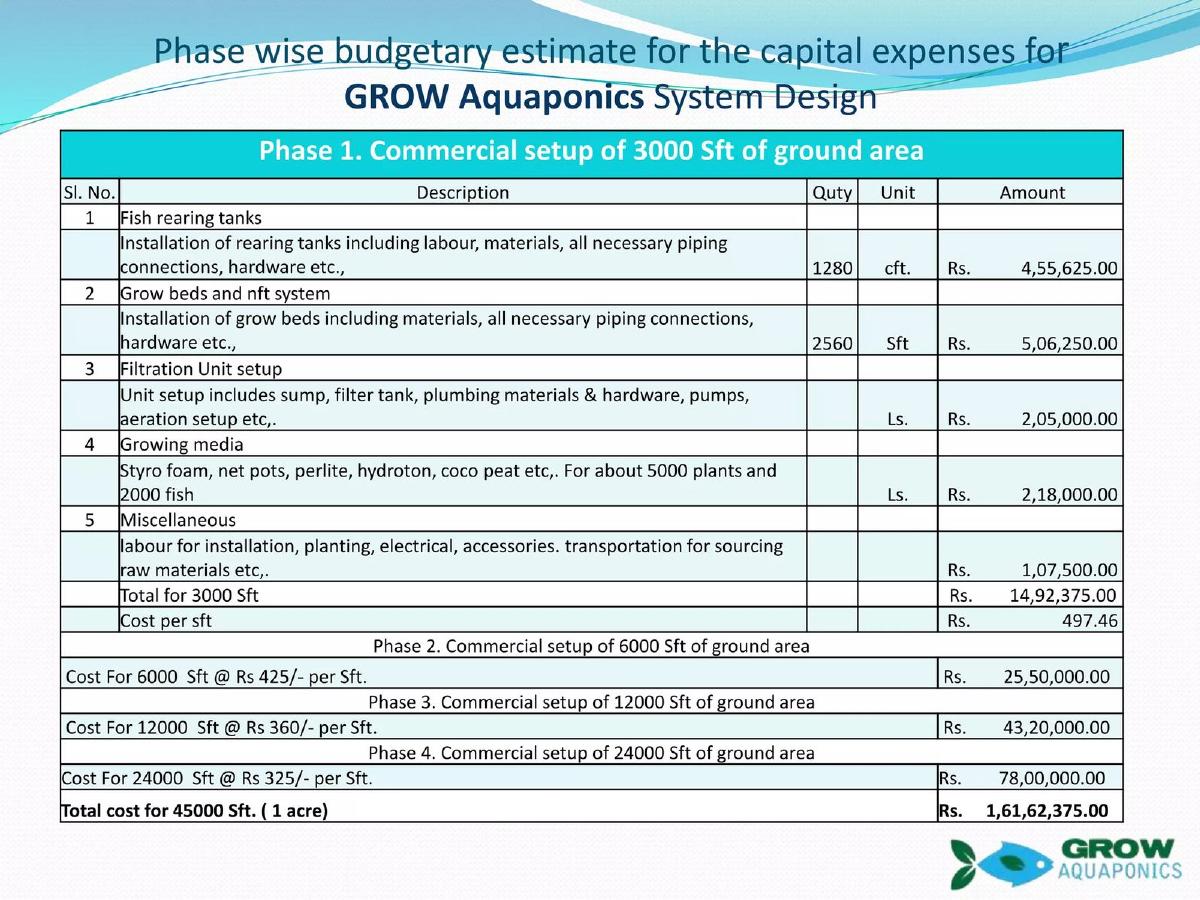
- Phase 1 requires a capital investment of Rs. 14,92,375.00 for a 3,000 square foot setup (Slide 2).
- Total capital expenditure for a 1-acre (45,000 Sft.) commercial setup is estimated at Rs. 1,61,62,375.00 (Slide 2).
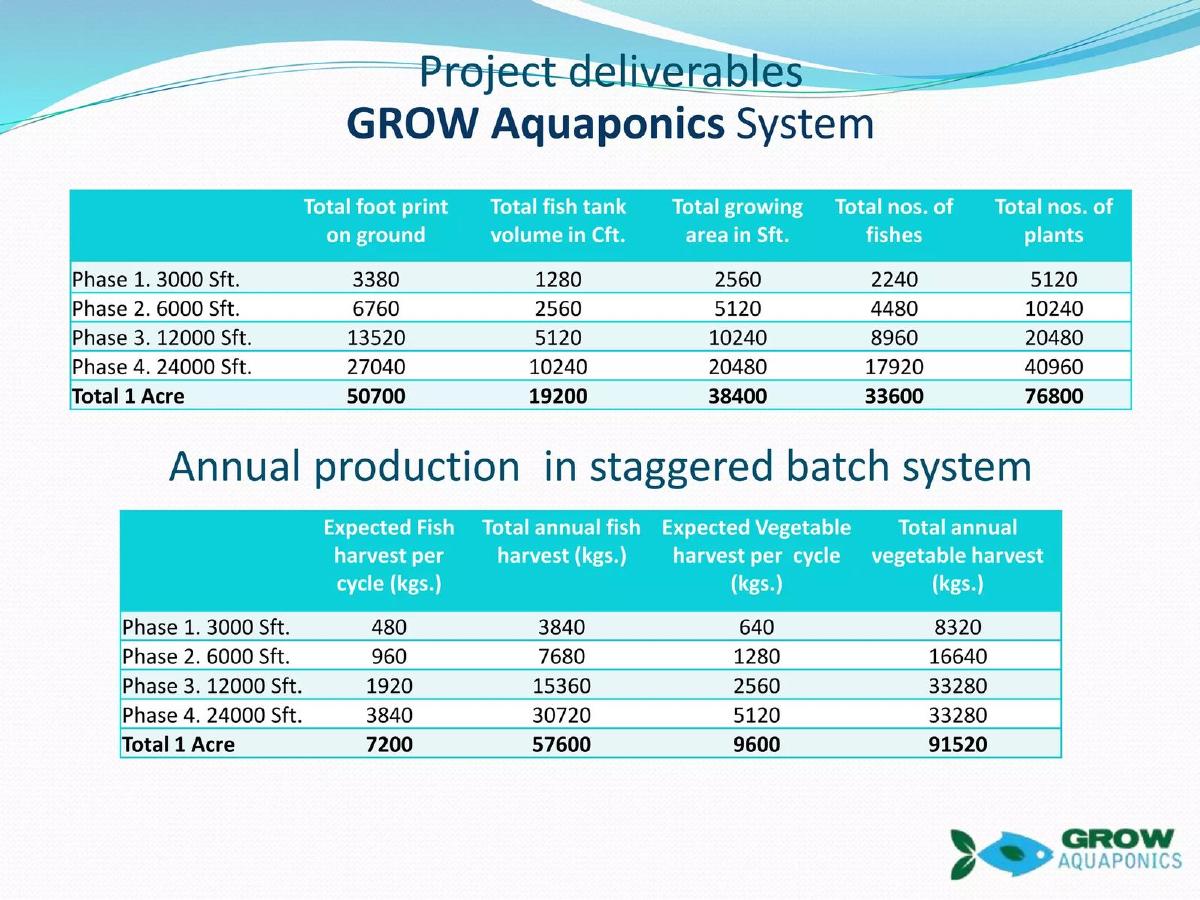
- Annual production for a full acre is projected at 57,600 kgs of fish and 91,520 kgs of vegetables (Slide 3).
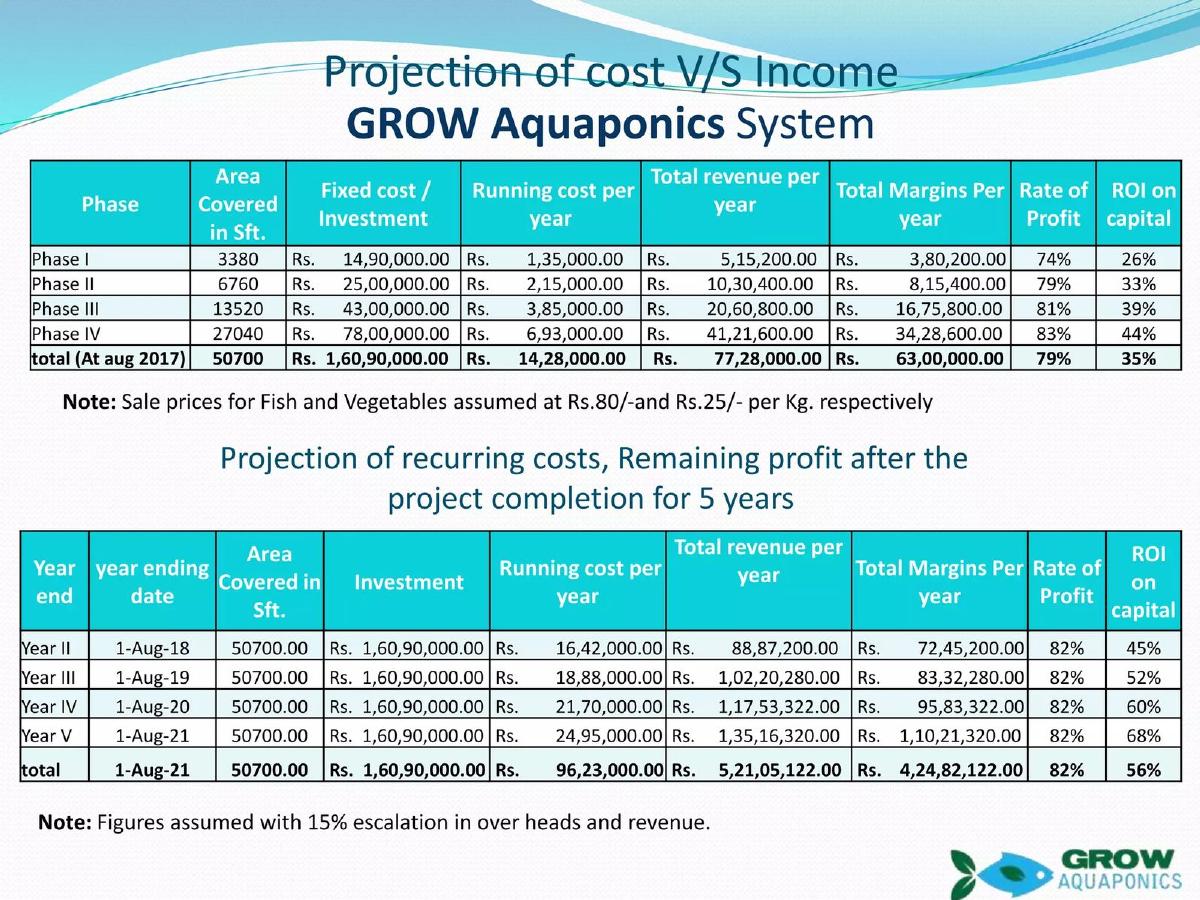
- The deck assumes sale prices of Rs. 80/- per kg for fish and Rs. 25/- per kg for vegetables (Slide 4).
- Projected ROI on capital increases from 26% in Phase I to 44% in Phase IV (Slide 4).
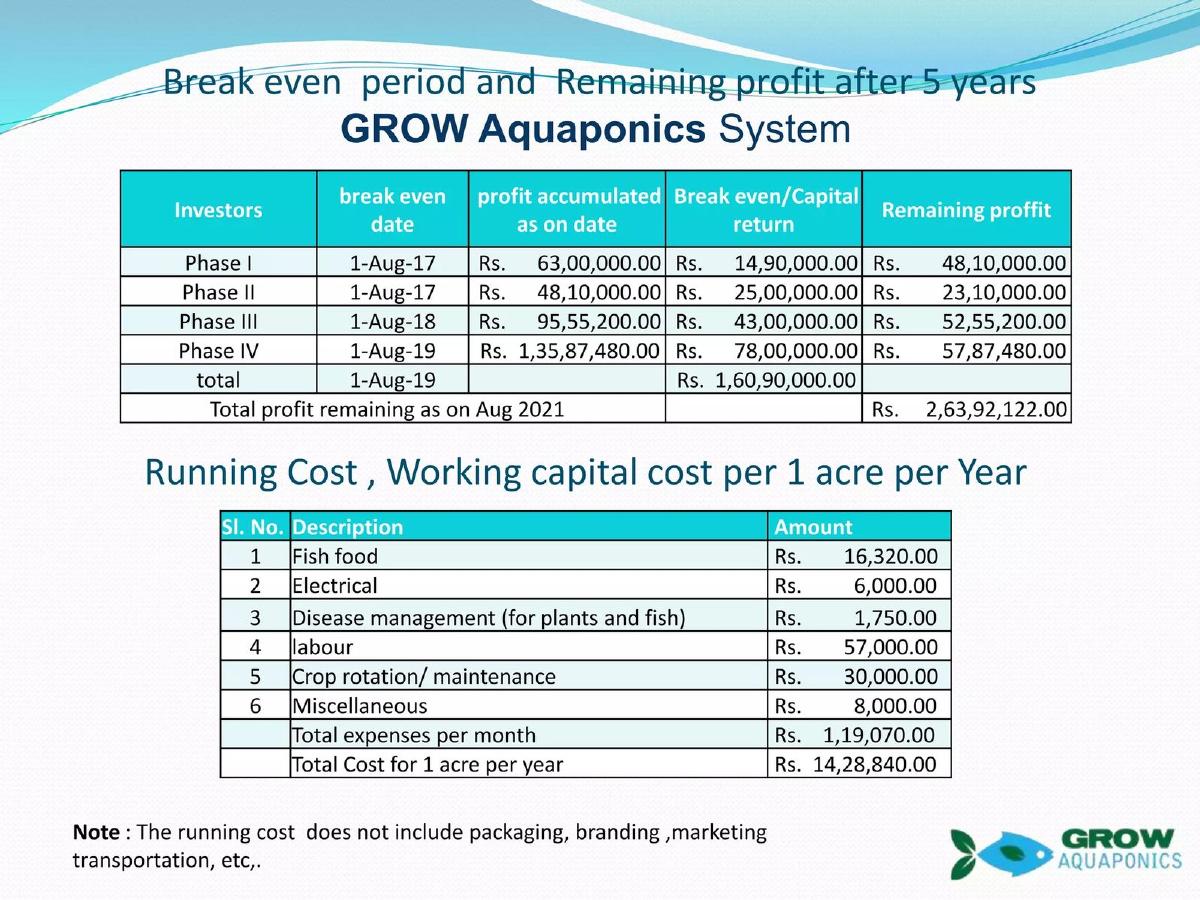
- Running costs for a 1-acre setup are calculated at Rs. 14,28,840.00 per year, with labor being the largest expense at Rs. 57,000.00 per month (Slide 5).
- The deck omits a team slide, a competitive landscape, and a specific investment 'ask' or equity offer (Slides 1-10).
Executive Summary: The Technical Blueprint Pitch
Grow Aquaponics presents a deck that is less of a 'story' and more of a 'spreadsheet.' In an industry often plagued by vague sustainability claims, this company chooses to lead with hard numbers, budgetary estimates, and phased scaling. While it lacks the polish of a Silicon Valley consumer tech deck, it provides the granular detail necessary for an infrastructure-heavy agricultural investment. However, the total absence of human capital—no team, no advisors, no history—creates a significant trust gap that the numbers alone may not be able to bridge.
Slide 1: Commercial Aquaponics Potentials & Benefits
The opening slide serves as both the 'Problem' and 'Solution' slide, though it focuses heavily on the latter. It lists the commercial benefits of aquaponics, including combined revenue from fish and vegetables and a yield increase of up to 6 times traditional methods. The environmental claims are bold: 98% water savings and a 'zero carbon footprint.' The inclusion of a simple diagram of 'The Aquaponics Cycle' (Fish > Microbes > Plants) helps ground the technical claims for non-expert investors. The mention of carbon credits suggests an additional revenue stream not fully explored in the later financial slides.
Slide 2: Phase Wise Budgetary Estimate
This is the most critical slide in the deck. It breaks down the capital expenses (CAPEX) for a 3,000 Sft. setup (Phase 1) with line-item precision. We see costs for fish rearing tanks (Rs. 4,55,625.00), grow beds (Rs. 5,06,250.00), and even miscellaneous labor (Rs. 1,07,500.00). The slide then extrapolates these costs for Phase 2, 3, and 4, culminating in a total 1-acre cost of Rs. 1,61,62,375.00. This level of transparency is rare and gives investors a clear 'price tag' for the project, though it doesn't specify how much of this total the company is currently seeking.
Slide 3: Project Deliverables and Annual Production
Slide 3 translates the square footage into biological output. It uses two tables to show the physical capacity and the annual harvest. For a 1-acre setup, the company expects to manage 33,600 fish and 76,800 plants. The 'Annual production in staggered batch system' table is vital because it shows the cash flow potential: 57,600 kgs of fish and 91,520 kgs of vegetables annually. By providing these figures, the founders allow investors to do their own 'sanity check' on the revenue projections.
Slide 4: Projection of Cost V/S Income
This slide moves from production to profitability. It calculates the 'Rate of Profit' and 'ROI on capital' for each phase. A key note at the bottom reveals the underlying assumptions: fish sold at Rs. 80/kg and vegetables at Rs. 25/kg. The ROI is shown to improve as the project scales, moving from 26% to 44% as fixed costs are amortized over a larger area. The second table on this slide provides a 5-year outlook, projecting that the ROI will reach 68% by Year V, assuming a 15% escalation in overheads and revenue.
Slide 5: Break Even and Running Costs
Slide 5 addresses the 'when' of the investment. It projects a total break-even date of August 2019 for the entire Rs. 1.6 Crore investment. The bottom half of the slide provides a monthly breakdown of running costs for a 1-acre farm, totaling Rs. 1,19,070.00 per month. Labor is the highest recurring cost at Rs. 57,000.00. Interestingly, a note mentions that these costs do not include packaging, branding, marketing, or transportation, which are significant omissions in a retail-facing business model.
Slide 6: Market Plans
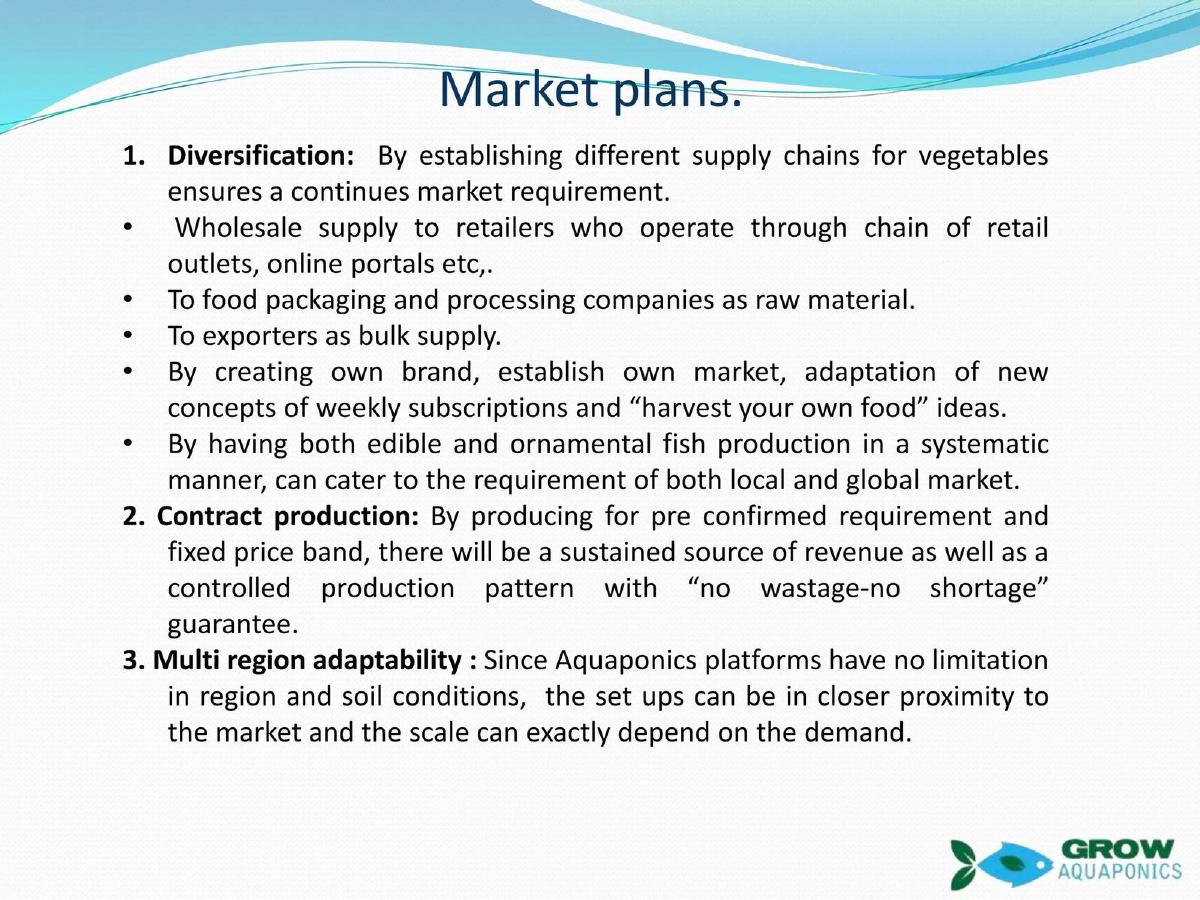
This slide outlines the go-to-market strategy. It focuses on three pillars: Diversification (wholesale, exporters, and a proprietary brand), Contract Production (fixed price bands to ensure sustained revenue), and Multi-region Adaptability. The mention of 'harvest your own food' ideas and weekly subscriptions suggests a B2C component, while 'bulk supply to exporters' targets the B2B market. However, there is no data on existing partnerships or letters of intent from these potential buyers.
Slides 7 & 8: The Produce
These two slides are purely visual, showing photographs of lettuce, mint, wheatgrass, cabbage, marigolds, basil, and tomatoes. The caption on Slide 7 claims these were grown in 'less than Half the time' of traditional methods. Slide 8 emphasizes that no additional fertilizer was used. While these photos provide 'proof of concept' that the system works at some scale, they lack context—there is no indication of whether these photos are from a pilot facility or a home-scale hobby system.
Slide 9: In Future...
The roadmap slide is brief. It mentions a second-stage milestone of expanding to 4 acres and establishing training centers for other farmers. The 'guaranteed buy back' model mentioned here is a common strategy in agricultural startups to build a supply network, but the deck does not explain how the company will finance these buy-backs.
Slide 10: Conclusion
The final slide includes a quote ('Nature does not need people, people need nature') and contact information. It lists a website (growaquaponics.g-r-o-w.in) and a Gmail address. The use of a generic Gmail address and a sub-domain website may signal a very early-stage or under-resourced operation to professional investors.
What Works in This Deck
Granular Unit Economics: The deck does an excellent job of breaking down exactly where capital goes and how much each square foot of the farm costs to build and operate. · Phased Approach: By breaking the project into four phases, the founders demonstrate a logical scaling path that allows for testing and optimization before reaching the full 1-acre scale. · Clear Assumptions: By stating the assumed sale prices for fish and vegetables (Rs. 80 and Rs. 25), the founders make their financial model auditable.
What Is Missing From This Deck
The Team: This is the most glaring omission. Investors fund people, especially in complex biological businesses like aquaponics. There is no information on who is running this venture. · The Ask: The deck lists the costs of the project but never explicitly states how much money they are raising, what the terms are, or how the funds will be allocated. · Competitive Landscape: The deck assumes a vacuum. It does not mention other commercial aquaponics firms or how they will compete with traditional soil-based industrial farms on price. · Risk Mitigation: Farming is inherently risky. The deck lacks a slide on how they handle power outages (which kill fish quickly), water contamination, or market price crashes.
Founder's Playbook: What to Copy
The CAPEX Table: Founders building hardware or infrastructure should copy the level of detail found on Slide 2. Showing that you know the cost of 'piping connections' and 'aeration setups' builds technical credibility. · Production Metrics: If you are in a production business, use a slide like Slide 3 to bridge the gap between your physical footprint and your revenue potential. · Staggered ROI Projections: Showing how ROI improves with scale (Slide 4) is a powerful way to justify why you need to grow quickly.
Frequently asked questions
- What is the primary value proposition of Grow Aquaponics?
- The primary value proposition is the efficiency and sustainability of a closed-loop farming system. According to Slide 1, the system saves up to 98% of water compared to traditional farming, eliminates the need for chemical fertilizers or pesticides, and produces up to six times the yield in the same footprint through vertical growing. It also highlights a 'zero carbon footprint' and the ability to generate carbon credits.
- How does the company plan to generate revenue?
- Revenue is generated through the dual harvest of fish and vegetables. Slide 4 outlines a staggered batch system where fish are sold at Rs. 80/kg and vegetables at Rs. 25/kg. The market plan on Slide 6 suggests diversifying income streams through wholesale supply to retailers, contract production with fixed price bands, and the creation of a proprietary brand for weekly subscriptions.
- What are the projected financial returns for investors?
- The deck projects a total profit of Rs. 2,63,92,122.00 by August 2021 (Slide 5). ROI on capital is expected to start at 26% for the initial small-scale phase and scale up to 68% by the fifth year of operation as the system reaches its full 1-acre capacity. The break-even period for the total investment is projected for August 2019.
- What are the biggest risks missing from this deck?
- The deck is optimistic regarding biological and market risks. It does not account for crop failure, fish disease outbreaks (beyond a small Rs. 1,750 monthly allocation for 'disease management'), or price volatility in the fish and vegetable markets. Furthermore, the lack of a team slide means there is no evidence that the founders have the technical expertise to manage a complex 1-acre aquaponics ecosystem.
- What is the 'Phase 4' scale of the project?
- Phase 4 represents the final stage of the initial commercial rollout, covering 24,000 square feet of ground area with a capital cost of Rs. 78,00,000.00 (Slide 2). At this scale, the system is expected to house 17,920 fish and 40,960 plants, producing a total annual margin of Rs. 34,28,600.00 (Slide 4).