The August 2016 GSR (Golden Star Resources) investor presentation is a detailed operational update aimed at institutional investors on the NYSE and TSX. The deck centers on three 'Transformational Milestones': the first stope blast at Wassa Underground, debt refinancing, and the upcoming commercial production at Prestea Underground. Unlike typical startup decks, GSR relies on heavy technical data, including mineral reserves (656Koz at Prestea), cash operating costs ($975/oz at Wassa), and specific capex breakdowns ($23.0m in Q2 2016). The narrative is one of transition—moving away from high-c…
Key takeaways
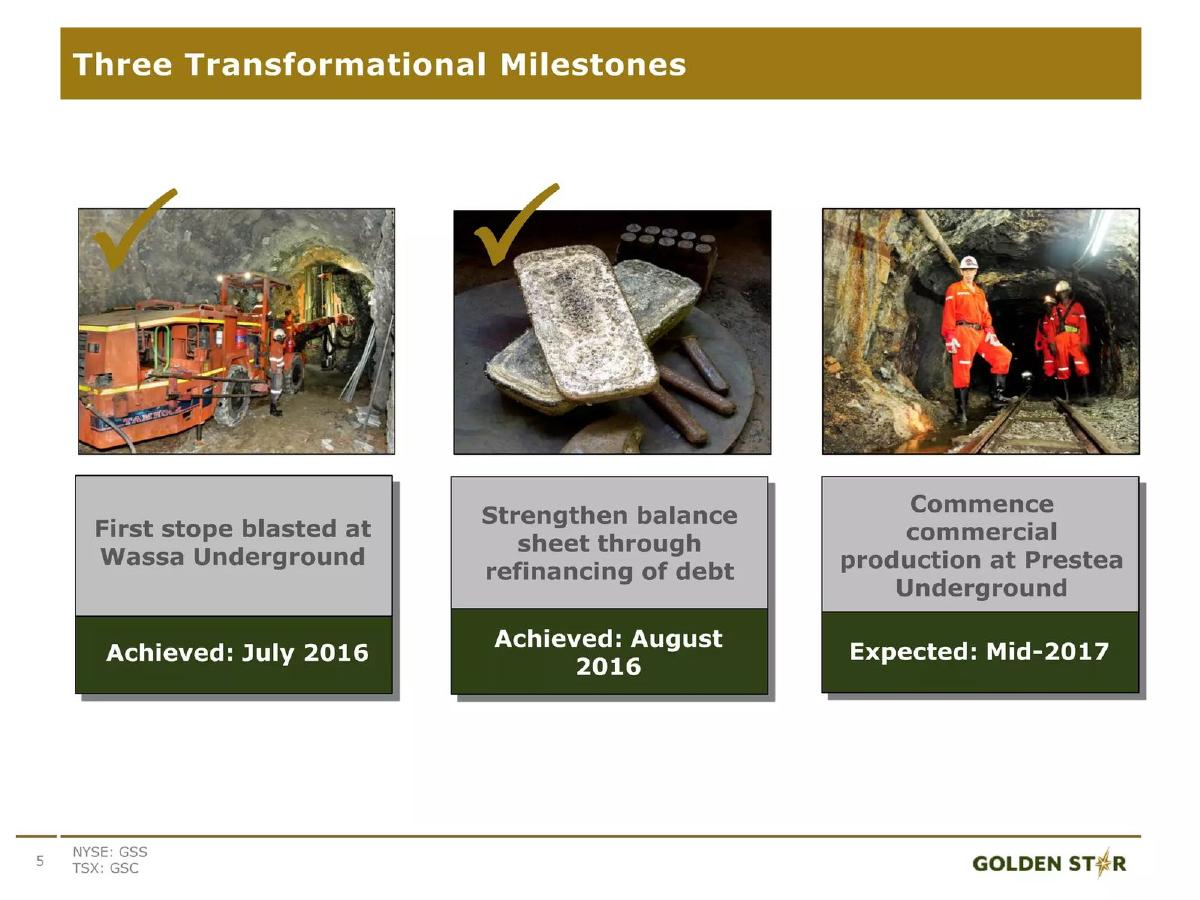
- The company achieved two major milestones in mid-2016: first stope blasting at Wassa Underground and debt refinancing (Slide 5).
- Capital expenditure saw an 80% year-over-year increase in Q2 2016, reaching $23.0m to fund underground development (Slide 9).
- Prestea Gold Mine is undergoing a strategic shift by phasing out high-cost refractory ore in favor of high-grade underground reserves (Slide 17).
- Mineral reserves at Prestea are cited at 656Koz, with underground reserves specifically noted at 14.02g/t for 469Koz (Slide 17).
- GSR holds the largest mineral concession on the Ashanti Gold Belt, totaling 387 square kilometers (Slide 21).
- The company has a 15-year production history with over 4Moz of gold produced to date (Slide 21).
- Operational results for Wassa in Q2 2016 show a production decline to 21,543oz due to a 2.5-week maintenance shutdown (Slide 29).
- Cash operating costs at Wassa Main Pit were $975/oz in Q2 2016, with a full-year guidance target of $800-900/oz (Slide 29).
GSR Investor Presentation: Transitioning to Underground Production
The August 2016 investor presentation for GSR (Golden Star Resources) is a technical document designed for the public markets, specifically targeting investors on the NYSE (GSS) and TSX (GSC). The narrative focuses on the execution of a capital-intensive transition from open-pit mining to underground operations in Ghana. This teardown examines the eight provided slides to understand how a mature mining company communicates operational shifts and capital allocation to its shareholders.
Slide 1: Title and Core Thesis
The cover slide establishes a clear, two-pronged value proposition: "Expanding Production and Reducing Costs." The imagery of heavy machinery in an open-pit environment immediately identifies the sector. The branding is consistent with Golden Star's corporate identity, and the date (August 2016) sets the context for the mid-year operational updates that follow.
Slide 5: Three Transformational Milestones
This slide serves as the executive summary of the company's recent progress. It uses a simple "check-mark" system to denote completed tasks versus upcoming goals. Achieved July 2016: First stope blasted at Wassa Underground. Achieved August 2016: Strengthening the balance sheet through debt refinancing. Expected Mid-2017: Commencement of commercial production at Prestea Underground. This slide is effective because it balances operational success with financial health, showing investors that the company is both hitting technical marks and managing its capital structure.
Slide 9: Investing In Our Future (Capex)
Mining is a capital-heavy business, and Slide 9 addresses this head-on. The company reports capital expenditures of $23.0m during Q2 2016, which represents an 80% increase compared to Q2 2015. The slide uses stacked bar charts to break down where this money is going. The visual evidence shows that the majority of the new spending is diverted to "Wassa Underground" and "Prestea Underground." This transparency is crucial for justifying the cash burn to investors; it demonstrates that the increased spending is an investment in higher-margin future assets rather than a sign of operational inefficiency.
Slide 13: Operations & Exploration Overview
This is a section divider slide. It features high-quality photography of night-time mining operations, emphasizing the 24/7 nature of the business. It lists the two primary assets: Wassa Gold Mine and Prestea Gold Mine. While it contains no data, it serves to focus the investor's attention on the specific asset-level teardowns that follow.
Slide 17: Prestea Gold Mine Strategy
Slide 17 details the strategic pivot at Prestea. The headline, "Refractory Ore Phased Out," is the most important piece of information here. Refractory ore is typically more expensive and difficult to process. By replacing these reserves with high-grade underground reserves (cited at 14.02g/t for 469Koz), GSR is signaling a move toward better unit economics. The slide also provides a comparative table: 2015 cash operating costs were $1,108/oz, while the 2016 forecast (during the transition) is lower at $840-970/oz. This is a clear data-backed argument for the company's new direction.
Slide 21: Regional Exploration Potential
To demonstrate long-term viability beyond current mines, Slide 21 focuses on the Ashanti Gold Belt. GSR claims the "largest mineral concession on Ashanti belt" at 387 square kilometers. The slide lists seven neighboring mines owned by major competitors like AngloGold Ashanti and Kinross. This "neighborhood" strategy is a common mining pitch tactic—it uses the success of nearby multi-million-ounce deposits to de-risk the exploration potential of GSR's own land. The slide also notes a 15-year production history with over 4Moz produced, establishing the company as an experienced operator rather than a speculative explorer.
Slide 29: Wassa Operational Results
This is a highly granular data slide. It compares Q2 2016 to Q2 2015 across seven metrics, including ore mined, grade processed, and recovery percentage. Gold production fell from 31,273oz in Q2 2015 to 21,543oz in Q2 2016. GSR proactively explains this decline in the bullet points, attributing it to a 2.5-week scheduled maintenance shutdown. By detailing the specific repairs (ball mill foundations, primary crusher components), the company prevents investors from assuming the production drop was due to ore body failure. The slide concludes with 2016 guidance, projecting 100-110Koz from the Main Pit and 20-25Koz from the new Underground development.
Slide 32: Contact Information
The final slide provides direct contact details for Investor Relations (Katharine Sutton) and lists the stock tickers for the NYSE MKT (GSS) and TSX (GSC). The background image of a reinforced mine portal reinforces the "underground" theme that permeates the entire presentation.
What GSR Does Well
GSR excels at technical transparency. In the mining sector, investors are wary of "grade skinning" or hidden operational failures. By providing exact recovery percentages (94.0% on Slide 29) and specific grade figures (14.02g/t on Slide 17), GSR builds credibility. They also do an excellent job of explaining the "why" behind their financial shifts, particularly the 80% increase in Capex, by visually linking the spend to the development of specific underground assets.
What Is Missing
Based on the 8 slides provided, there are several key omissions that a private equity or venture investor might look for, though they may be less critical for public market updates:
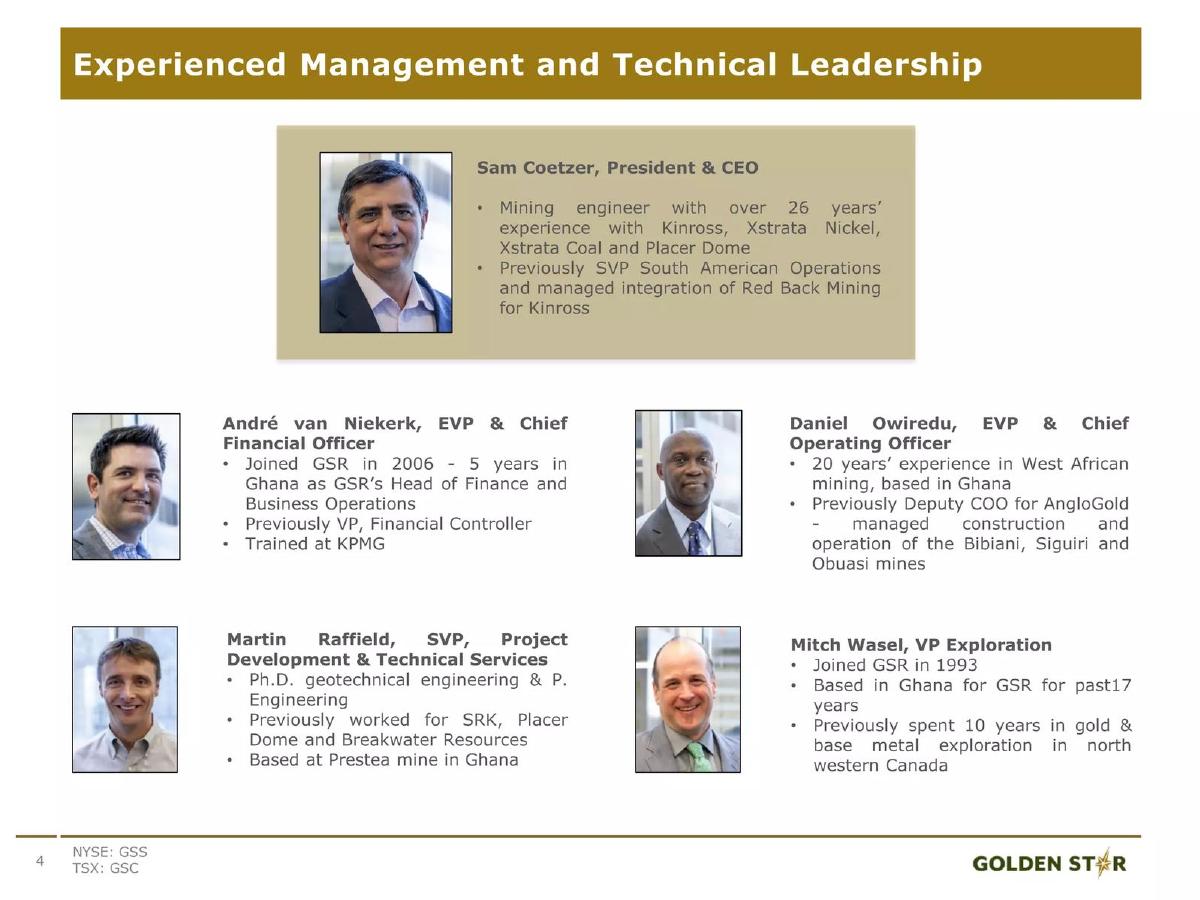
Management Team: There is no slide detailing the experience of the executive team or the board of directors. · Unit Economics/All-In Sustaining Costs (AISC): While "Cash Operating Costs" are provided, the deck does not explicitly highlight AISC, which is the industry standard for total cost transparency. · Environmental and Social Governance (ESG): For a company operating in Ghana, there is a lack of information regarding community relations, environmental reclamation, or safety records (LTI rates), which are increasingly important to modern investors. · Use of Refinanced Funds: Slide 5 mentions debt refinancing, but there is no detail on the terms, interest rates, or how much liquidity was freed up.
What Founders Should Copy
Founders in capital-intensive industries (like hardware, manufacturing, or energy) should study Slide 9. Instead of just saying "we need more money for R&D," GSR shows a year-over-year comparison and uses a stacked bar chart to prove that the new capital is being funneled into the highest-value future projects. This turns a "high burn rate" narrative into an "aggressive growth" narrative. Additionally, the use of "Milestones" on Slide 5 is a perfect way to anchor a presentation; it tells the investor exactly what has been de-risked and what the next catalyst for value creation will be.
Frequently asked questions
- What is the primary strategic goal outlined in the GSR deck?
- The primary goal is the transition from open-pit mining to underground production at the Wassa and Prestea mines. This shift is intended to reduce long-term operating costs and access higher-grade ore. Slide 5 explicitly lists the commencement of commercial production at Prestea Underground as the next major milestone for mid-2017.
- How does GSR justify the significant increase in capital expenditure?
- GSR reports an 80% increase in Capex for Q2 2016 compared to Q2 2015 (Slide 9). The company justifies this by showing that the bulk of the $23.0m spend is directed toward 'Wassa Underground' and 'Prestea Underground' development, which are the pillars of their future production growth and cost-reduction strategy.
- What are the specific production targets for the Wassa Gold Mine?
- According to Slide 29, the 2016 production guidance for Wassa is 100,000 to 110,000 ounces from the Main Pit, plus an additional 20,000 to 25,000 ounces from the Wassa Underground development. They aim for cash operating costs between $800 and $900 per ounce.
- What is the significance of the Ashanti Gold Belt to GSR's value proposition?
- GSR positions itself as a dominant regional player by highlighting that it holds the largest concession area (387 sq km) on the 250km Ashanti Gold Belt (Slide 21). By listing seven other major mines in close proximity, such as Tarkwa and Obuasi, they validate the geological potential of their land package.
- How does the deck address operational risks like maintenance?
- The deck is transparent about operational headwinds. Slide 29 explains a decline in Q2 2016 production at Wassa by citing a 2.5-week scheduled maintenance shutdown. It details the specific work completed, including ball mill foundation rebuilding and crusher component replacement, to show that the downtime was a necessary investment in infrastructure.