Intelen's 2013 pitch deck for the CeBIT event outlines a strategy to tackle energy inefficiency through gamification and behavioral analytics. Founded in 2010 from research, the company focuses on 'behavioral Smart Grids,' using a mobile platform called In.Gage to incentivize users with points and prizes for energy-saving actions. The deck reports managing over 0.5 MWh per month and having raised $250K in 2011. While the product visualization is strong, showing mobile interfaces and administrative dashboards, the deck lacks a clear financial 'ask' for the next round and omits a dedicated team…
Key takeaways
- Intelen defines its core value proposition as 'Customer Engagement for Energy Efficiency using Social Mobile Game Mechanics' on slide 1.
- The company was founded in 2010 based on research and raised $250K in seed funding in 2011, according to slide 7.
- The In.Gage mobile app uses a points system where actions like 'Green Team Action' or 'Fault Logged' earn users redeemable points (slide 5).
- Intelen claims to manage over 0.5 MWh per month as of the 2013 pitch (slide 7).
- The platform includes a 'Leadership board' and 'GreenTeam Effectiveness' tracking to foster competition among building occupants (slide 6).
- The deck highlights global recognition from organizations like OECD, Siemens, and Red Herring (slide 7).
- A significant omission is the lack of a specific fundraising target or 'ask' slide in the provided sequence.
- The technical architecture involves mapping 'Efficiency Behaviors' and 'Efficiency Building Actions' to an engagement cycle (slide 2).
Intelen Pitch Deck Teardown
Intelen’s 2013 pitch for the CeBIT event represents an early attempt to merge the burgeoning field of 'Smart Grids' with the consumer-facing trend of gamification. At a time when energy efficiency was largely viewed through the lens of hardware and industrial automation, Intelen focused on the 'human element'—specifically, how to use mobile technology and social incentives to change how people interact with the buildings they inhabit.
Slide 1: Title and Positioning
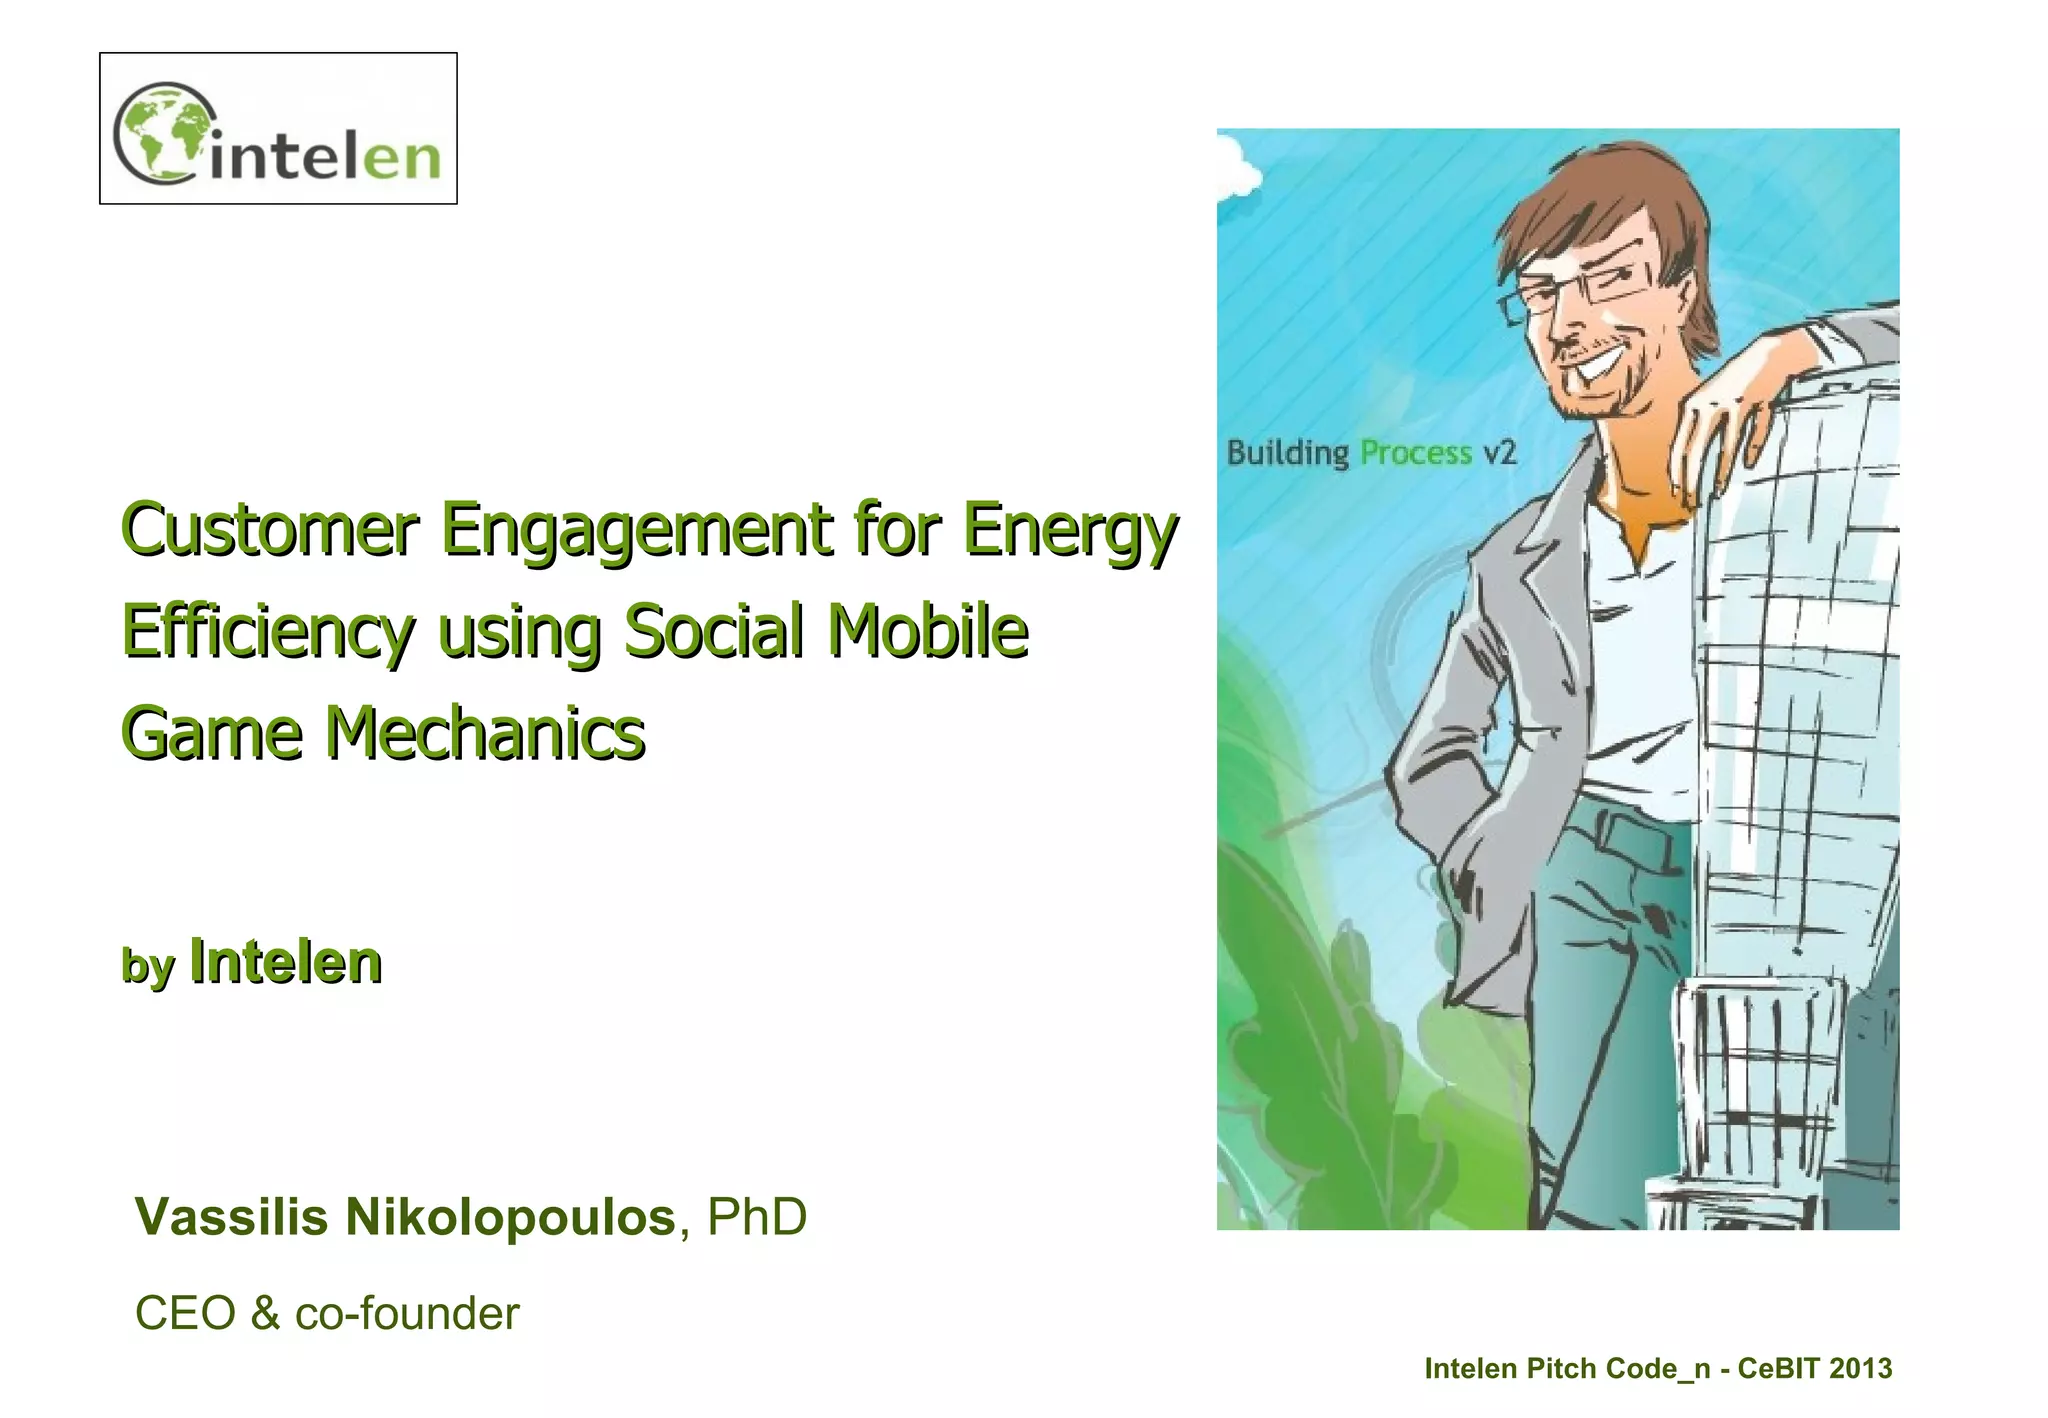
The cover slide establishes the company's identity and its specific niche. The title, "Customer Engagement for Energy Efficiency using Social Mobile Game Mechanics," is descriptive, though perhaps a bit wordy for a modern deck. It clearly identifies the three pillars of the business: energy efficiency, social/mobile platforms, and gamification. The presenter is identified as Vassilis Nikolopoulos, PhD , CEO & co-founder. The inclusion of the 'PhD' title and the 'Building Process v2' illustration suggests a company rooted in academic research and iterative development. The branding is consistent, featuring a green and earth-toned logo that aligns with the environmental sector.
Slide 2: The Behavioral Mapping Process
Slide 2 serves as the conceptual framework for the product. It uses a flow diagram to show how data from "Consumers" and "Buildings" is fed into "Analytics." This process identifies "Efficiency Behaviors" and "Efficiency Building Actions." The core of the slide is the "Engage Behavior Mapping" cycle, which aims to:
Evaluate efficiency actions. · Optimize consumer engagement. · Project behaviors to an efficiency plan. · Adapt humans to building interventions.
This slide is crucial because it explains the 'why' behind the app. It isn't just about tracking data; it's about a feedback loop that attempts to synchronize human activity with building management systems.
Slide 3: The Connected Ecosystem
This slide provides a high-level overview of the Intelen platform's reach. At the center is the Intelen logo, described as "Data Analytics to Engage." Arrows point to various touchpoints:
Smart Grid Infrastructure: Represented by power lines and solar panels. · Mobile Users: People interacting with smartphones and tablets. · Social Integration: A Facebook interface showing 'Intelen Energy Analytics v2.0.' · Administrative Dashboards: Detailed charts showing yearly energy consumption, CO2 savings (1818.83 gr), and cost savings (€134.02).
This visualization helps investors understand that Intelen is a full-stack solution, connecting the physical grid to the end-user's social feed and the building manager's desktop.
Slide 4: In.Gage Mobile Interface - Tasks and History
Slide 4 introduces the "In.Gage" brand. It showcases the mobile application's UI, which was quite modern for 2013. The screens show a user profile (Vassilis Nikolopoulos) with 6500 Total Points , broken down into 4250 status points and 2250 redeemable points. The 'My History' screen lists specific actions like 'Green Action' (closing unnecessary lighting) and 'Mood' checks (comfort level of heating). Each action is timestamped and shows a corresponding percentage reduction in energy use (e.g., -2.3% or -3.1%). This is a strong slide because it proves the product is built and functional, moving beyond abstract concepts to concrete user experiences.
Slide 5: In.Gage Mobile Interface - Rewards and Gamification
Continuing the product deep-dive, Slide 5 focuses on the 'Redeem' aspect of the gamification. It lists various ways to earn points:
Green Team Action (+10 Status, +1 Redeemable) · Fault Logged (+10 Status, +1 Redeemable) · Mood Answer (+5 Status, +1 Redeemable) · Quiz Answer (+50 Status, +5 Redeemable) · Tip Read (+10 Status, +2 Redeemable)
The right side of the slide shows a 'Pick a Prize' screen where points can be spent on a $10 Amazon Gift Card (1000 points), 2 movie tickets (2000 points), or 2 concert tickets (5000 points). This slide clearly defines the incentive structure, though it leaves open the question of who funds these prizes—the building owner, the utility, or Intelen?
Slide 6: Administrative Dashboard and Analytics
Slide 6 shifts from the consumer view to the manager view. The dashboard includes a "Leadership board" ranking employees by points, and a "Current GreenTeam Effectiveness" chart. Key metrics displayed include:
Current Mood: 88.23% · Energy Trend: -7.34% · Estimated Savings: 1459.22 € · kWh Saved: 1245.45 KWh · Engagement: 77.34% · Awareness: 89.23%
This slide is excellent for demonstrating the ROI of the platform. By showing that the system tracks both 'soft' metrics (mood, awareness) and 'hard' metrics (kWh saved, Euro savings), Intelen makes a compelling case for building managers who need to justify the software's cost.
Slide 7: Company Milestones and Traction
Founded in 2010 from research. · Raised $250K (2011) , securing more seed funding towards Series A. · Focus on next-generation behavioral Smart Grids. · Already managing over 0,5MWh/month . · Operating in Athens, with a USA NYC presence and expansion.
The bottom of the slide features logos for the Red Herring Global 100 , Silicon Valley Launch , and the OECD . This slide establishes credibility and shows that the company has already achieved international recognition and initial funding.
Slide 8: The Closing Pitch
The final slide in the sequence is a simple, high-impact graphic. It features the tagline: "We game it! You save it!" and a summary of the mission: "Combine building analytics and gamification to engage consumers and save energy costs." The background illustration of a green, sunlit building reinforces the environmental benefits. While it serves as a good 'thank you' slide, in a fundraising context, this is usually where the 'Ask' or contact information would be placed.
What Works in the Intelen Deck
Strong Product Visualization: The deck does a fantastic job of showing, rather than just telling. By including multiple screenshots of the mobile app and the administrative dashboard, the founders prove that the technology is mature and ready for deployment. The UI looks professional and the metrics shown (like the -7.34% energy trend) feel authentic.
Clear Value Proposition: The link between gamification and energy savings is explained clearly through the behavioral mapping slide. It moves the conversation away from "we have a smart meter" to "we have a way to make people care about the smart meter," which is a much more valuable proposition in the energy sector.
Third-Party Validation: Listing awards from the OECD, Siemens, and Red Herring provides immediate social proof. For a startup coming out of Greece (Athens) and looking to expand into the US market, this validation is critical for building trust with international investors.
What is Missing from the Intelen Deck
The Financial Ask: The most significant omission is a clear fundraising target. While slide 7 mentions they are "securing more seed funding towards Series A," it doesn't state how much they are raising, at what valuation, or what the specific milestones for that capital will be. A pitch deck without an 'Ask' is just a presentation.
The Team Slide: While the CEO is mentioned on the cover, there is no slide detailing the broader team. Investors at the seed and Series A stages invest in people as much as products. The deck would benefit from highlighting the technical leads, data scientists, and any advisors with experience in the utility or real estate sectors.
Business Model and Unit Economics: The deck shows prizes being given away (Amazon gift cards, movie tickets), but it doesn't explain the underlying business model. Is this a SaaS play for building owners? Does the utility pay for the energy reduction? Who pays for the prizes? Without explaining the revenue flow, the sustainability of the business is unclear.
Competitive Landscape: There is no mention of competitors. In 2013, companies like Opower were already making waves in behavioral energy efficiency. Addressing how Intelen differs from these incumbents—perhaps through its focus on commercial buildings rather than residential—would have strengthened the pitch.
Founder Takeaways
Use Data to Tell a Story: Intelen excels at using specific numbers (like the 1245.45 kWh saved) to ground their claims. When pitching a technical or industrial solution, using real-world data from pilots or early deployments is the best way to overcome skepticism.
Gamification Needs a Purpose: Many startups try to 'gamify' things without a clear link to value. Intelen avoids this by mapping specific 'Green Actions' to measurable energy reductions. If you are using game mechanics, ensure you can show exactly how those mechanics drive the core business metric.
Bridge the Physical and Digital: For IoT or Smart City startups, showing the connection between hardware (the grid), software (the analytics), and the user interface (the app) is vital. Slide 3 is a great example of how to visualize a complex ecosystem in a single, understandable graphic.
Frequently asked questions
- What is the primary problem Intelen is trying to solve?
- Intelen addresses the gap between building energy data and actual human behavior. While many systems track energy use, they often fail to motivate occupants to change their habits. Intelen uses gamification—specifically social mobile game mechanics—to engage consumers and drive 'Efficiency Behaviors' that lead to measurable energy savings.
- How does the In.Gage platform incentivize users?
- The platform, shown on slides 4 and 5, uses a reward system where users earn points for specific tasks. For example, a 'Green Team Action' earns +10 status points and +1 redeemable point. These points can be used to 'buy' prizes such as $10 Amazon Gift Cards (1000 points) or movie tickets (2000 points), turning energy saving into a competitive game.
- What kind of traction did Intelen have at the time of this pitch?
- According to slide 7, Intelen was managing over 0.5 MWh per month. They had also secured $250K in seed funding in 2011 and were operating in Athens with a presence in New York City. The deck also lists several awards, including being a Red Herring Global 100 winner and receiving recognition from the OECD and Siemens.
- What are the key components of the Intelen technical ecosystem?
- Slide 3 illustrates a connected ecosystem where data flows between smart grids/buildings and the Intelen analytics engine. This data is then pushed to various interfaces: a mobile app for consumers, a Facebook integration for social sharing, and a web-based dashboard for administrators to monitor trends, ROI, and 'GreenTeam' effectiveness.
- What critical information is missing from this pitch deck?
- The deck lacks a formal 'Ask' slide detailing how much capital they are looking to raise and how it will be deployed. Additionally, there is no detailed team slide highlighting the backgrounds of the co-founders or key engineers, and the unit economics of the prize-based reward system are not explained.