Venalytica’s deck, dating to approximately 2011, addresses the problem of online shopping dissatisfaction, citing that 49% of shoppers in 2009 felt results didn't match their preferences (Slide 2). The solution is a mobile application where users manually weight attributes like cost and performance to receive ranked product recommendations (Slide 3). The business model relies on a dual-track revenue stream: affiliate commissions from major retailers like Best Buy and Wal-Mart, and B2B predictive analytics sold via dashboards and APIs (Slide 4). While the deck features a strong technical lead…
Key takeaways
- The problem is defined by rising consumer dissatisfaction, with 'unrelated to search' results increasing from 33% in 2007 to 54% in 2009 (Slide 2).
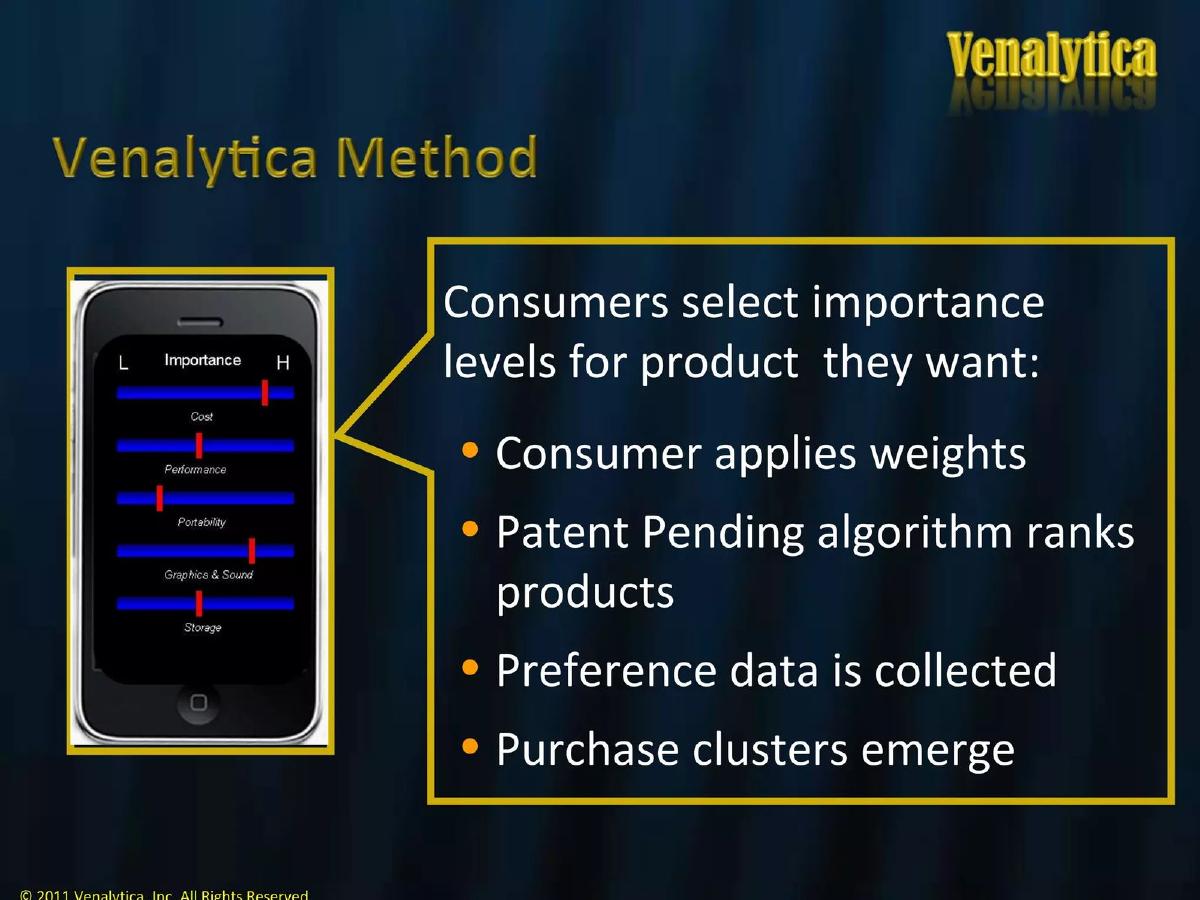
- The core product is a mobile interface allowing users to toggle 'Importance' sliders for product attributes (Slide 3).
- Revenue is generated through affiliate marketing with seven named retail partners and B2B data sales (Slide 4).
- The company claims a 'patent pending' algorithm for ranking products based on user-applied weights (Slide 3).
- The technical leadership is highlighted through Jon Fenner, who previously served as CTO at HotChalk and ProductFactory (Slide 8).
- Venalytica differentiates itself from Omniture and CoreMetrics by focusing on preference weight rather than cookies or page views (Slide 9).
- The deck targets mobile platforms specifically, mentioning both iPhone and 'Droid' (Slide 10).
- There is no slide detailing the current capital structure, the amount being raised, or the intended use of funds.
Venalytica: A 2011-Era Look at Intent-Based E-Commerce
The Venalytica investor deck, presented to AngelList, serves as a time capsule for the early 2010s mobile commerce boom. At a time when 'Droid' was a primary competitor to the iPhone and 'big data' was transitioning into 'predictive analytics,' Venalytica sought to bridge the gap between search and purchase intent. The deck focuses heavily on the friction in the online shopping experience and proposes a technical solution rooted in user-defined weighting.
Slide 1: Title Slide
The cover slide is minimalist, featuring the Venalytica logo in a gold, embossed font with a reflection. It explicitly states 'Presented to: AngelList.' This indicates the deck was likely used for a syndicate or a direct outreach campaign on the then-nascent AngelList platform. The dark blue, curtain-like background is a common aesthetic choice for the era but provides no information about the company's industry or value proposition.
Slide 2: Reasons For Dissatisfied Online Shoppers
Venalytica establishes the 'Problem' by citing a ChoiceStream 2009 Personalization Survey. The data shows a troubling trend for e-commerce: 'Unrelated to Search' dissatisfaction grew from 33% in 2007 to 54% in 2009. The slide highlights 'Didn’t Match Preferences' at 49% in 2009. By using three years of data, the founders attempt to show that the problem is not just existing, but worsening as the volume of online products increases. This is a classic 'growing pain' argument for a new technology solution.
Slide 3: Venalytica Method
This slide introduces the 'Solution.' It features a mockup of an early smartphone app with five sliders: Cost, Performance, Portability, Graphics & Sound, and Storage. The 'Method' is broken down into four steps: consumers apply weights, a patent-pending algorithm ranks products, preference data is collected, and purchase clusters emerge. This slide is critical because it introduces the company's primary intellectual property claim—the algorithm—and explains how they generate the data they eventually plan to sell.
Slide 4: Revenues
The business model is split into two categories. Affiliate Marketing & Commissions is the immediate B2C monetization strategy, listing major retailers like Best Buy, Wal-Mart, Sears, Target, Verizon, T-Mobile, and ATT. The second category is Predictive Analytics , which is the B2B play. This involves selling Dashboards and API access to the data collected from the app. This 'double-dip' revenue model is common in early-stage tech, aiming to prove value to consumers while building a high-margin data business.
Slide 5: Why Can’t Anyone Just Do It Themselves?
This slide acts as a 'Defensibility' or 'Moat' argument. It makes four claims: the expertise of the founder, the difficulty of the decision model, the bottlenecked nature of retail IT departments, and the company's 'agile, flexible and hungry' nature. While the first two points are substantive, the latter two are generic. The mention of 'Retailers IT departments are typically bottlenecked' is a strong sales point for a B2B SaaS solution, suggesting that retailers would rather buy than build.
Slide 6: How Purchase Decisions Are Made
Using the example of buying a laptop, this slide visualizes the complexity of consumer choice. It lists 16 different product data points (Processor Speed, Price, HDMI, etc.) and shows how different user personas (Road Warrior, Student, Home User, Commuter, Gamer) place different importance on these attributes. This slide effectively illustrates the 'Why' behind the sliders shown on Slide 3, demonstrating that a one-size-fits-all search result is inherently flawed.
Slide 7: Mission Statement
The mission is stated as: 'We provide software and services that help consumers zero in on the right products to fit their individual needs.' It positions Venalytica as a 'Pioneer in Consumer Preference Analytics.' The slide lists two goals: improving sales conversion rates and reporting on fine-grained consumer preferences. This slide bridges the gap between the consumer-facing app and the business-facing data service.
Slide 8: Jon Fenner – CTO & VP Engineering
This is the only biographical slide in the provided set. Jon Fenner is presented as a seasoned technical leader. His experience includes being President and CEO of Auraquest, Inc., and CTO/VP of Engineering at HotChalk, Inc. (2004-2006) and ProductFactory, Inc. (2000-2004). The slide emphasizes his experience in building prototypes, initial production platforms, and managing company infrastructure. The absence of a CEO or other founders in this slide set is a notable omission.
Slide 9: Competitive Assessment
Venalytica compares itself to three groups of competitors. Against CoreMetrics and Omniture , they claim to capture 'preference weight' rather than just cookies. Against Endeca, FAST, and IBM , they claim to rank results so the 'best match is at the top.' Against Google, Oracle, and SAP , they claim to be more 'consumer friendly' and focused on conversions at the point of sale (POS). This table is well-structured, clearly defining the 'Strength' of the competitor and 'Why We’re Better.'
Slide 10: Mobile / In-Store
The final slide in the set reinforces the mobile-first nature of the product. It mentions the app is for 'iPhone or Droid' and helps both 'in-store or internet shoppers.' A mockup shows a laptop with a price tag of $329.99 and a 'Buy Now!' button. This slide emphasizes the utility of the app as a shopping assistant that can be used while standing in a physical retail aisle, a concept that was highly popular during the 'showrooming' era of retail.
What Works in the Venalytica Deck
The deck does an excellent job of defining a specific, data-backed problem . By citing the ChoiceStream survey, they move away from anecdotal evidence and show a clear trend of consumer frustration. The use of the laptop example on Slide 6 is also a very effective way to explain a complex algorithmic concept to a non-technical investor. It makes the 'Method' on Slide 3 feel intuitive rather than abstract.
Furthermore, the revenue model is clear and diversified . By listing specific retailers they intend to partner with, they show they have a clear understanding of the affiliate landscape. The transition from affiliate revenue to high-margin API and dashboard revenue is a logical progression for a data-centric startup.
What is Missing from the Venalytica Deck
The most glaring omission is the lack of a complete team . While Jon Fenner has an impressive technical background, an investor needs to know who is leading the business, sales, and operations. A CTO-only slide suggests a company that might be heavy on engineering but light on market execution.
There is also no mention of traction or milestones . The deck doesn't state if the app is currently in the App Store, how many users they have, or if they have any existing pilot programs with the retailers listed on Slide 4. Without these 'de-risking' metrics, the pitch remains purely theoretical.
Finally, the absence of an 'Ask' slide is a major hurdle. A pitch deck is a functional tool meant to facilitate a transaction. By not stating how much capital is needed, what the valuation expectations are, or how the money will be spent (e.g., hiring, marketing, R&D), the deck fails to close the loop with the investor.
Founder Takeaways: What to Copy
Use specific examples: The laptop attribute breakdown (Slide 6) is the strongest part of the deck. If your product is an 'engine' or an 'algorithm,' always provide a concrete use case that a layperson can understand. · Cite your sources: Don't just say 'people are unhappy.' Use industry surveys or internal data to prove the market gap, as seen on Slide 2. · Address the 'Build vs. Buy' question: Slide 5 correctly identifies that even if a large company could build a solution, their internal bottlenecks often prevent it. This is a powerful argument for B2B startups. · Segment your competition: Don't just list competitors in a row. Group them by their 'type' (e.g., Analytics vs. Search vs. Platforms) to show you understand the different angles of the market.
Frequently asked questions
- What is the primary problem Venalytica aims to solve?
- Venalytica targets the inefficiency of online search and recommendation engines. Citing a 2009 ChoiceStream survey, the deck notes that nearly half of shoppers are dissatisfied because results don't match their preferences or are unrelated to their search. They aim to replace passive tracking (cookies) with active user input to improve conversion rates for retailers.
- How does the Venalytica algorithm work according to the deck?
- The process involves a consumer manually applying weights to specific product attributes (e.g., cost, performance, portability) via a slider interface. A 'patent pending' algorithm then ranks products based on these importance levels. This creates 'purchase clusters' and fine-grained preference data that the company can then sell back to retailers as predictive analytics.
- Who are the target customers and partners?
- The deck identifies two distinct customer groups. First, individual consumers using the mobile app for in-store or online shopping. Second, major retailers such as Best Buy, Wal-Mart, Sears, Target, Verizon, T-Mobile, and AT&T, who provide affiliate commissions and are the intended buyers of the company's analytics dashboards and API access.
- What are the major omissions in this pitch deck?
- The deck is missing several standard venture components. There is no 'Ask' slide detailing how much money is being raised. It lacks a financial slide showing historical revenue or future projections. Furthermore, the team section is incomplete, featuring only the CTO/VP of Engineering without mentioning a CEO, founders, or advisors.
- How does Venalytica view its competitive landscape?
- Venalytica categorizes competitors into three tiers: analytics firms (CoreMetrics, Omniture), search providers (Endeca, FAST, IBM), and platform giants (Google, Oracle, SAP). Their stated advantage is the ability to capture 'true purchase intent' and 'preference weight' rather than just tracking page views or providing generic turnkey solutions.