This 2015 investor deck for Diplomat Pharmacy (DPLO) serves as a post-IPO update focusing on the company's aggressive growth in the specialty pharmacy sector. The deck highlights a 46% revenue increase from 2013 to 2014 and the acquisition of BioRx to bolster margins. Diplomat positions itself as a 'nimble' alternative to large PBMs like CVS Health and Express Scripts, while maintaining national reach that smaller competitors lack. Key metrics include a rising Gross Profit per Script, which grew from $71 in 2010 to $167 in 2014. The deck effectively uses patient-centric storytelling alongside…
Key takeaways
- Diplomat reported 46% revenue growth from 2013 to 2014, outperforming the broader specialty pharmacy market growth of 24% (Slide 3).
- The company secured 10 new drug contracts since its IPO, 7 of which are limited distribution drugs (Slide 3).
- Gross Profit per Script increased significantly over five years, rising from $71 in 2010 to $167 in 2014 (Slide 21).
- The acquisition of BioRx is highlighted as a margin-accretive move, bringing in 29% gross margins and approximately 10% EBITDA margins (Slide 15).
- Diplomat differentiates itself from 'Large PBM/Retail Pharmacy' by claiming a singular focus on specialty and a more flexible, high-touch model (Slide 12).
- The 'Journey of a specialty patient' diagram illustrates Diplomat's involvement at every stage, from benefit verification to monitoring adherence (Slide 9).
- Future growth is tied to the launch of biosimilars and specialty generics like Temodar and Xeloda (Slide 15).
- The deck includes detailed financial footnotes, including a $4.8 million impairment charge related to an investment in Ageology (Slide 27).
Slide-by-Slide Analysis
Slide 1: Title and Patient Narrative
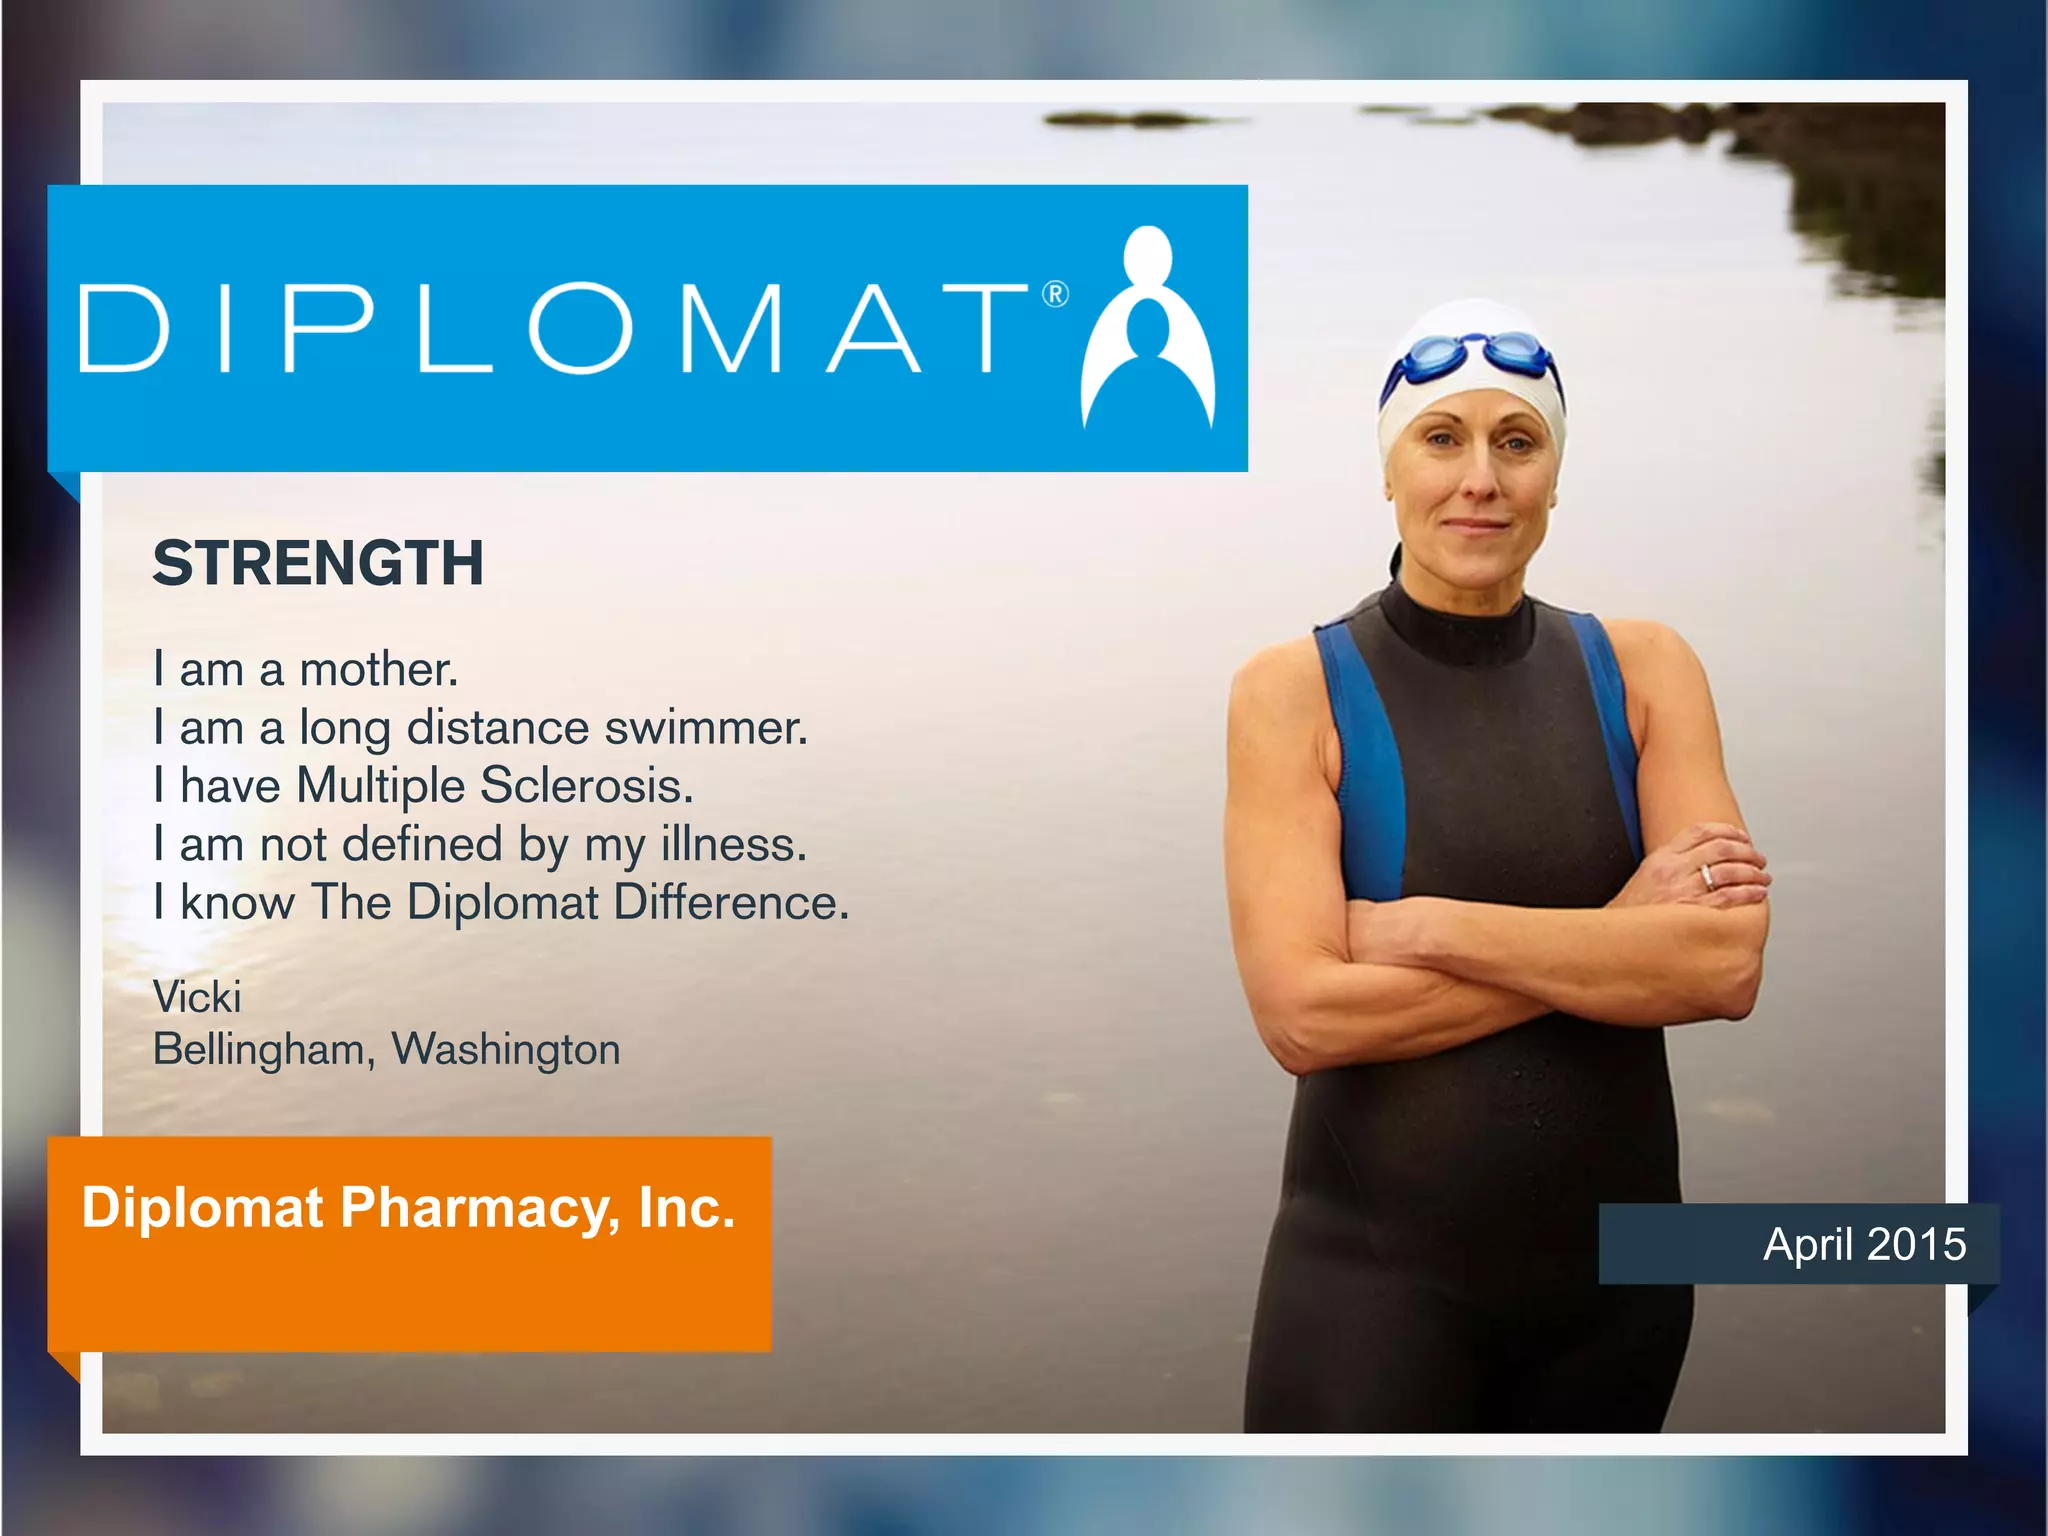
The deck opens with a high-impact visual of a patient named Vicki, a long-distance swimmer with Multiple Sclerosis. This establishes the 'human' element of specialty pharmacy immediately. The slide includes the company name, Diplomat Pharmacy, Inc., and the date, April 2015. It uses the tagline 'Strength' to frame the patient experience.
Slide 3: Market Momentum
This slide provides the macro-economic justification for the business. It notes that the specialty pharmacy market grew 24% from $63bn in 2013 to $78bn in 2014. Crucially, it shows Diplomat outperforming the market with 46% revenue growth in the same period. It lists 10 new drug contracts since the IPO, including high-profile names like Harvoni (Hepatitis C) and Ibrance (Oncology). 7 of these are limited distribution drugs, which serves as a competitive moat.
Slide 6: Key Investment Highlights
A standard summary slide using a curved timeline graphic. It lists five pillars: taking share in high growth sectors, unique competitive positioning, an experienced management team, an outstanding financial profile, and multiple avenues for long-term growth. This acts as a roadmap for the rest of the presentation.
Slide 9: Journey of a Specialty Patient
This circular flow diagram explains the operational complexity Diplomat manages. It tracks the patient from the initial physician visit through benefit verification, prior authorization, and drug dispensing. It highlights that Diplomat doesn't just ship pills; they monitor adherence and collect data for manufacturers, positioning them as a data partner to Big Pharma.
Slide 12: Unique Competitive Position
This is a classic 'Goldilocks' slide. On the left, it lists large PBMs/Retailers like Express Scripts, CVS Health, and Walgreens, claiming they are 'less flexible' and 'distracted by diversification.' On the right, it lists smaller specialty pharmacies like Avella and Axium, noting they have 'limited scale.' Diplomat places itself in the center, claiming to be the only player with both 'National reach' and a 'Singular focus on specialty.'
Slide 15: Multiple Avenues for Future Growth
This slide focuses on margin expansion. It highlights the acquisition of BioRx, noting its 29% gross margin and ~10% EBITDA margin. It also points to the 'Specialty generics and biosimilars' market, specifically mentioning that Copaxone is coming off patent soon. This suggests a strategy of moving away from low-margin distribution toward higher-margin clinical services and generic alternatives.
Slide 18: Visual Transition
A simple transition slide titled 'Outstanding financial profile' featuring a collage of photos showing patients, pharmacists, and corporate teams. It serves to pivot the deck from strategy to hard numbers.
Slide 21: Continued Growth in Profitability
This is the most data-dense slide in the set. It tracks 'Gross Profit / Script' from 2010 to 2014. The metric has scaled from $71 to $167. The bar chart shows a clear acceleration in 2014 (44% growth). A separate call-out for Q4 comparison shows a 48% jump to $187. The slide attributes this to a mix shift toward higher-priced drugs and favorable pricing trends.
Slide 24: Appendix
A simple header slide marking the end of the primary narrative and the beginning of the supporting data.
Slide 27: Reconciliation of Net Income and Adjusted EBITDA
This slide provides the necessary accounting transparency for institutional investors. It includes eight detailed footnotes explaining one-time charges, such as a $932k write-down of a former headquarters in Michigan, a $4.8m impairment for an investment in 'Ageology,' and costs associated with converting from an S-Corporation to a C-Corporation. This level of detail is typical for a public company (DPLO) maintaining investor trust.
What Diplomat Does Well
Metric Selection: By focusing on 'Gross Profit per Script,' Diplomat moves the conversation away from simple top-line revenue (which can be inflated by high drug prices) to the actual value they capture per transaction. This is a much more convincing metric for long-term sustainability.
Competitive Moats: The emphasis on 'Limited Distribution Drugs' is a strong signal to investors. If manufacturers only allow a handful of pharmacies to dispense a drug, Diplomat's inclusion in those panels represents a significant barrier to entry for new competitors.
Strategic M&A Narrative: The deck doesn't just say they bought BioRx; it explains why (higher margins) and how it fits into the broader 'Specialty Infusion' growth strategy.
What is Missing
Specific Team Slide: While Slide 6 mentions a 'Highly experienced and incentivized management team,' the 10 slides provided do not include a dedicated team slide with bios or track records. For a company of this scale, investors would want to see the specific pedigree of the clinical and financial leadership.
Risk Factors: As a 2015 deck, it lacks a robust discussion of the regulatory risks regarding drug pricing, which became a major headwind for the pharmacy sector in the years following this presentation.
The 'Ask': Because this is an investor update for a public company, there is no 'we are raising $X million' slide. Founders using this as a template should remember to add a clear funding requirement and use of proceeds slide.
What Founders Should Copy
The 'Journey' Slide: Slide 9 is an excellent way to visualize a complex service business. It shows the founder understands every friction point in their industry and has a solution for each one. If your startup sits between multiple stakeholders (patients, doctors, insurers), a journey map is essential.
The Comparison Frame: Slide 12 is a masterclass in positioning. Instead of just saying 'we are better,' they define the specific weaknesses of 'too big' and 'too small' competitors, leaving their company as the only logical choice in the middle.
Footnote Transparency: The level of detail on Slide 27 regarding one-time losses and impairments is something early-stage founders often avoid. However, being upfront about 'bad' news or one-time charges builds immense credibility with sophisticated investors.
Frequently asked questions
- What is Diplomat's core value proposition compared to retail pharmacies?
- According to Slide 12, Diplomat argues that large retail pharmacies and PBMs are distracted by diversification, making them less flexible. Diplomat claims a 'singular focus' on specialty drugs, allowing for a high-touch model and an entrepreneurial culture that smaller pharmacies cannot scale to a national level.
- How has Diplomat's profitability per unit changed over time?
- Slide 21 shows a consistent upward trend in Gross Profit per Script. It grew from $71 in 2010 to $167 in 2014. Specifically, Q4 2014 saw a 48% growth in this metric compared to Q4 2013, reaching $187 per script.
- What role does M&A play in Diplomat's strategy?
- M&A is a central pillar for margin expansion. Slide 15 highlights the acquisition of BioRx, which operates in the specialty infusion market with 29% gross margins. Slide 12 also notes that the fragmented market of smaller specialty pharmacies presents a 'consolidation opportunity' for Diplomat.
- What market tailwinds is the company riding?
- Slide 3 identifies several trends: the specialty pharmacy market grew from $63bn to $78bn in one year, and specialty drug approvals accounted for over 50% of all FDA approvals in 2014. Additionally, there are over 3,000 oncology and immunology drugs currently in global development.
- How does Diplomat handle drug distribution restrictions?
- Diplomat emphasizes its success in securing 'limited distribution panels.' Slide 3 notes that 7 of their 10 new post-IPO drug contracts are for limited distribution drugs, which are often high-cost, high-complexity medications that manufacturers only trust to specific partners.