Evine’s November 2016 presentation positions the company as a critical member of a three-company oligopoly alongside QVC and HSN, collectively generating $9.5 billion in annual U.S. revenue. The deck emphasizes a transition from traditional media to a direct-to-consumer model, leveraging a new management team and improved logistics through a Bowling Green fulfillment center. Financially, the company highlights a +160 bps improvement in gross profit margin and a +2% increase in gross profit dollars as of Q2 2016, despite a slight -2% dip in net sales. The presentation serves as a progress repo…
Key takeaways
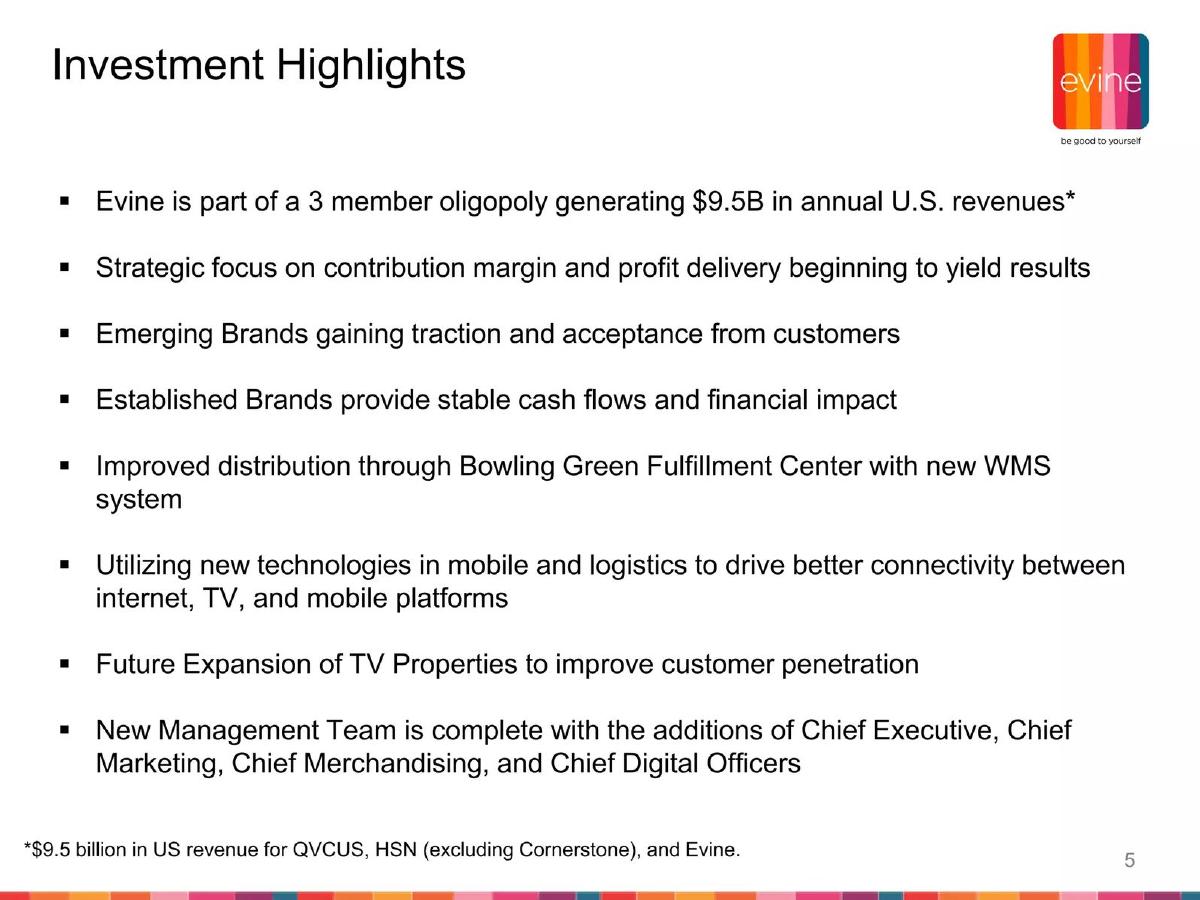
- Evine identifies as part of a three-member oligopoly with QVC and HSN, controlling a $9.5 billion U.S. market (Slide 5).
- The company reported a +160 bps increase in gross profit margin and a +2% increase in gross profit dollars for Q2 2016 (Slide 9).
- Net sales saw a slight decline of -2% in Q2 2016 compared to the previous year (Slide 9).
- Management underwent a significant overhaul, adding new Chief Executive, Marketing, Merchandising, and Digital officers (Slide 5).
- The retail strategy focuses on the 'Direct to Consumer' model, positioning Evine alongside digital-native brands like Wayfair and Jet (Slide 13).
- Logistics improvements were centered on a new WMS system at the Bowling Green Fulfillment Center (Slide 5).
- The balance sheet shows a total shareholder equity of $70.6 million as of July 30, 2016 (Slide 21).
- Accumulated deficit stood at $354 million by Q2 2016, reflecting long-term historical losses (Slide 21).
Introduction: The Multiplatform Retail Strategy
The November 2016 investor presentation for Evine (now known as ShopHQ) represents a company in the midst of a strategic pivot. At the time of this deck, the retail landscape was reeling from the rapid ascent of e-commerce giants, and traditional home shopping networks were forced to reinvent themselves as multiplatform commerce hubs. Evine’s deck is a classic example of a 'turnaround' narrative, focusing on margin improvement, management renewal, and logistical efficiency rather than raw user growth.
Slide 1: Title Slide
The presentation opens with the Evine logo—a colorful, striped square—and the tagline "be good to yourself." It is dated November 2016. The branding is clean and modern, signaling a departure from the cluttered aesthetic often associated with legacy home shopping channels. The simplicity of this slide sets a professional tone for an institutional investor audience.
Slide 5: Investment Highlights
This slide serves as the executive summary. It makes a bold claim: Evine is part of a "3 member oligopoly" generating $9.5B in annual U.S. revenues. The footnote clarifies that this figure includes QVC, HSN, and Evine. By using the word "oligopoly," the company is signaling to investors that the market is consolidated and protected by high barriers to entry. Other key points include a strategic focus on contribution margin, the completion of a new management team (CEO, CMO, CMerchO, and CDO), and improved distribution through a new Warehouse Management System (WMS) at their Bowling Green facility. This slide effectively communicates that the 'house is in order' and the leadership is new.
Slide 9: Focus on Driving Improved Contribution Margin
This is a critical data slide. It uses three large yellow circles to highlight Q2 2016 performance compared to Q2 2015. The metrics are specific: a -2% dip in Net Sales, but a +160 bps increase in Gross Profit Margin and a +2% increase in Gross Profit Dollars. The bar charts for Net Sales and Gross Profit show seasonal fluctuations (with Q4 being the obvious peak), but the narrative here is clear: the company is willing to sacrifice a small amount of top-line revenue to secure higher-quality, more profitable sales. This is a common theme in mid-stage turnarounds where the goal is to reach break-even.
Slide 13: Well-Positioned for Dynamic Retail Landscape
Slide 13 provides the theoretical framework for Evine’s existence. It depicts a central column of "Direct to Consumer" brands, including Amazon, Jet, QVC, HSN, and Evine. Flanking this are "Traditional Media" (NYT, CBS, ABC) labeled as "Declining" and "Traditional Retail" (Walmart, Target, Sears) labeled as "Transforming." The slide argues that the merchant’s ideal relationship is "Directly With The Customer." By placing themselves in the same vertical as Amazon and Wayfair, Evine attempts to distance itself from the 'dying' sectors of print media and physical department stores.
Slide 17: Second Quarter 2016 Financial Performance
This slide expands on the data from Slide 9, adding Adjusted EBITDA and Net Income (Loss) charts. The Adjusted EBITDA chart shows a positive trend, growing from $2.5 million in Q2 2015 to $3.8 million in Q2 2016. However, the Net Income chart shows the company is still in the red, reporting a -$2.0 million loss for Q2 2016. While this is an improvement over the -$3.0 million loss in the same quarter the previous year, it highlights the ongoing struggle to reach net profitability. The use of red bars for losses and the specific quarterly comparisons provide a transparent, if sobering, look at the bottom line.
Slide 21: Summary Balance Sheet
The balance sheet provides a deep dive into the company’s financial health from 2013 through Q2 2016. Total assets are listed at $262.3 million. A few notable figures stand out: Cash and restricted cash grew to $40.1 million by July 2016, up from $12.3 million in January 2016. However, the "Accumulated deficit" is a massive $354.1 million. This figure represents the total historical losses of the company since its inception. For an investor, this indicates a long history of burning capital, though the recent increase in cash suggests a successful capital raise or improved cash flow management in the short term.
Slides 25 & 29: Brand Showcases (Cailyn and Sonya Dakar)
These slides are purely visual and serve to showcase the quality of the brands Evine carries. Slide 25 features Cailyn cosmetics with high-end product photography against a floral background. Slide 29 features Sonya Dakar skincare with a clean, 'natural' aesthetic involving green leaves and apples. These slides are intended to prove that Evine is a viable platform for premium beauty brands, moving away from the 'as-seen-on-TV' bargain bin reputation. They act as social proof for the "Emerging Brands" strategy mentioned on Slide 5.
Slide 33: Closing Slide
The deck ends as it began, with the Evine logo and tagline. There is no specific "Ask" slide in this selection, which is typical for a public company investor presentation or a general update deck rather than a specific venture capital pitch. The focus is on maintaining investor confidence through transparent reporting of operational improvements.
What Evine Does Well
The deck is exceptionally strong at framing the competitive landscape. By defining the market as a three-player oligopoly, they immediately make the company seem more significant than a standalone e-commerce site. They also do a great job of highlighting "quality of earnings" over "quantity of earnings." In a period where many companies were chasing growth at all costs, Evine’s focus on basis point improvements in gross margin (Slide 9) shows a disciplined management team focused on the path to profitability.
The visual transition between the data-heavy financial slides and the high-gloss brand slides (25 and 29) helps balance the presentation. It reminds investors that while the numbers are the priority, the underlying business is driven by consumer-facing products and brand relationships.
What is Missing from the Deck
The most glaring omission in this selection of slides is a detailed breakdown of customer acquisition costs (CAC) and lifetime value (LTV). While they mention "customer penetration" on Slide 5, they do not provide data on how much it costs to acquire a viewer versus a digital shopper. In a multiplatform model, understanding the cross-channel behavior of the customer is vital.
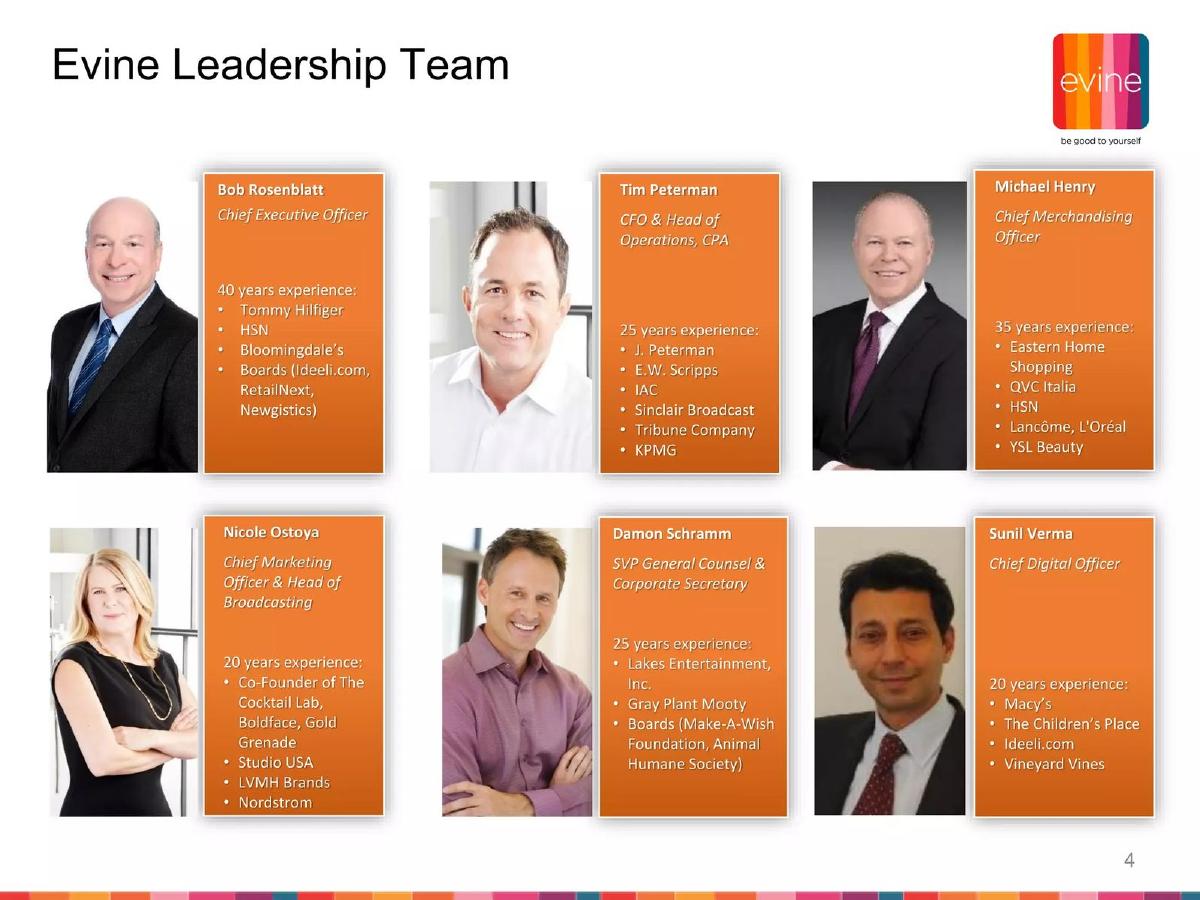
Additionally, while they mention a "New Management Team," there are no bios or headshots for these individuals in the provided slides. Investors invest in people, especially in a turnaround scenario. Without knowing the track records of the new CEO or Chief Digital Officer, it is difficult to assess the likelihood of the strategy's success. Finally, the deck lacks a clear roadmap for the "Future Expansion of TV Properties" mentioned on Slide 5—it is a bullet point without a timeline or budget.
Lessons for Founders
1. Frame Your Market Power: If you are in a niche with few competitors, use terms like "oligopoly" or "market leader" to emphasize the difficulty others will have entering the space. Evine’s use of the $9.5B figure for the three-member group makes them feel like a titan by association.
2. Own Your Losses: Evine did not hide their net loss or their accumulated deficit. By presenting these figures alongside improvements in EBITDA and Gross Margin, they created a narrative of "steady progress" rather than "failure." Founders should always lead with the trend line when the absolute numbers are still negative.
3. Connect Strategy to Infrastructure: Many decks talk about "scaling" without explaining how. Evine specifically mentions their Bowling Green Fulfillment Center and a new WMS system. This gives investors confidence that the company has the physical and technical capacity to handle the growth they are projecting.
4. Use Visual Anchors: If your business relies on third-party partners (like brands or merchants), show them off. The high-quality imagery on Slides 25 and 29 does more to communicate the "vibe" and quality of the platform than a list of brand names ever could.
Frequently asked questions
- What is Evine's primary market position according to the deck?
- Evine positions itself as a key player in a three-company oligopoly in the U.S. home shopping and multiplatform retail space. According to Slide 5, this group—consisting of QVC, HSN, and Evine—generates $9.5 billion in annual U.S. revenue. By framing the market as an oligopoly, Evine suggests high barriers to entry and a stable competitive landscape where they hold significant, defensible market share.
- How did Evine's financial health look in mid-2016?
- The financials were a mix of operational improvement and historical burden. Slide 17 shows Adjusted EBITDA grew to $3.8 million in Q2 2016, up from $2.5 million in Q2 2015. However, the company still reported a net loss of $2.0 million for the quarter. Slide 21 reveals a substantial accumulated deficit of $354 million, though cash and investments increased to $40 million by July 2016.
- What was the core of Evine's 'turnaround' strategy?
- The strategy focused on shifting from top-line growth at any cost to improving contribution margins and profitability. Slide 9 highlights a 160 basis point improvement in gross profit margin. This was supported by a new management team (Slide 5) and a focus on 'Emerging Brands' to attract new customers while relying on 'Established Brands' for stable cash flow.
- How does Evine view the changing retail landscape?
- Slide 13 illustrates a shift where traditional media (newspapers, broadcast TV) is declining and traditional brick-and-mortar retail is transforming. Evine places itself in the 'Direct to Consumer' center, connecting merchants directly to consumers. They view themselves as a hybrid that combines the reach of television with the transactional efficiency of mobile and internet platforms.
- What infrastructure investments did the company highlight?
- The company emphasized its Bowling Green Fulfillment Center and the implementation of a new Warehouse Management System (WMS). According to Slide 5, these logistics upgrades were intended to drive better connectivity between their internet, TV, and mobile platforms, ensuring that the backend could support their multi-channel sales strategy.