The WestRock investor presentation from March 2017 is a high-density financial document designed for institutional investors rather than venture capital. Spanning 35 slides (9 analyzed here), it centers on the strategic acquisition of Multi Packaging Solutions (MPS) and the subsequent divestiture of the Home, Health, and Beauty business. The deck is notable for its extreme granular detail, providing reconciliations for non-GAAP measures like Adjusted EBITDA and Adjusted EPS, alongside exhaustive operational data such as shipment volumes by region and commodity consumption. By presenting a com…
Key takeaways
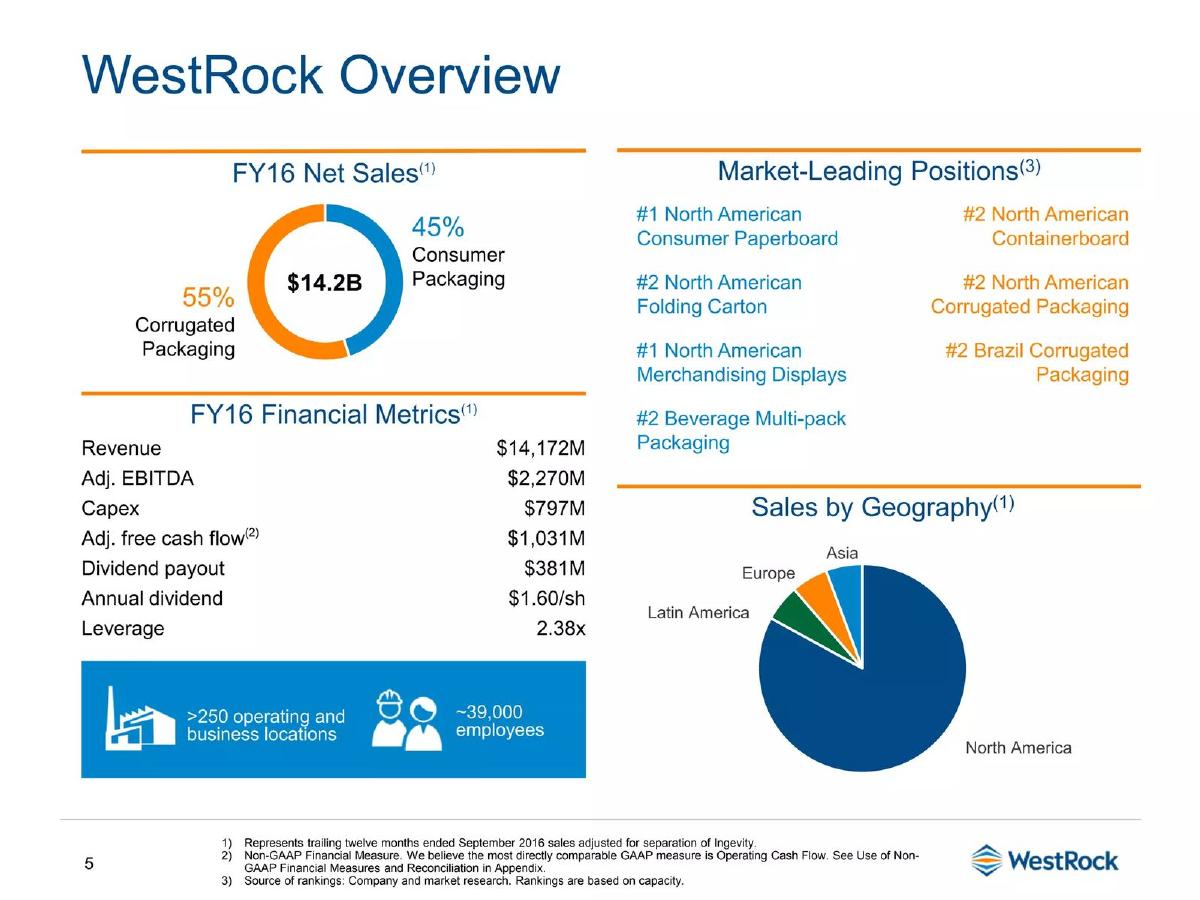
- The company reported FY16 net sales of $14.2 billion, split between 55% Corrugated Packaging and 45% Consumer Packaging (Slide 5).
- WestRock maintains dominant market positions, including #1 rankings in North American Consumer Paperboard and Merchandising Displays (Slide 5).
- The acquisition of Multi Packaging Solutions is the primary strategic driver of this presentation (Slide 12).
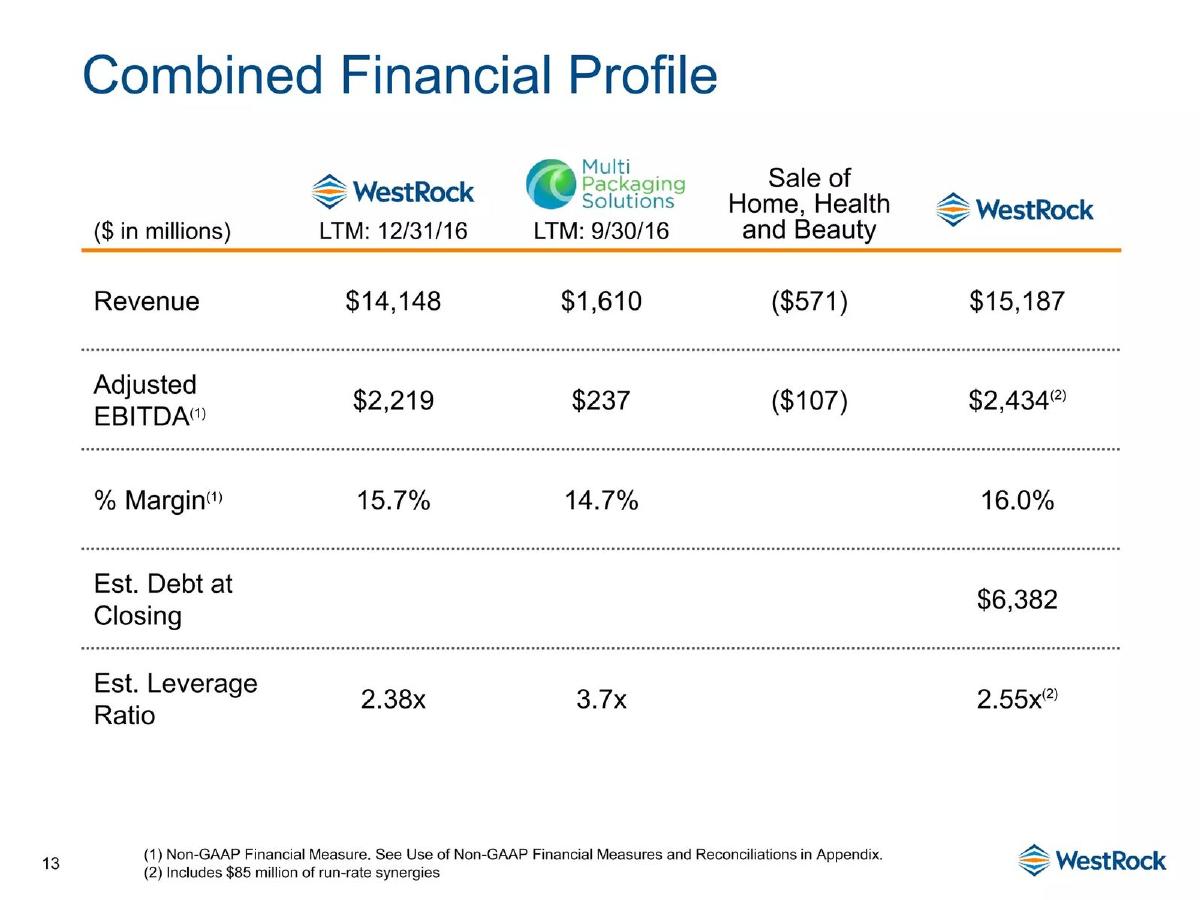
- Pro forma financials show a combined revenue of $15.187 billion after accounting for the sale of the Home, Health and Beauty segment (Slide 13).
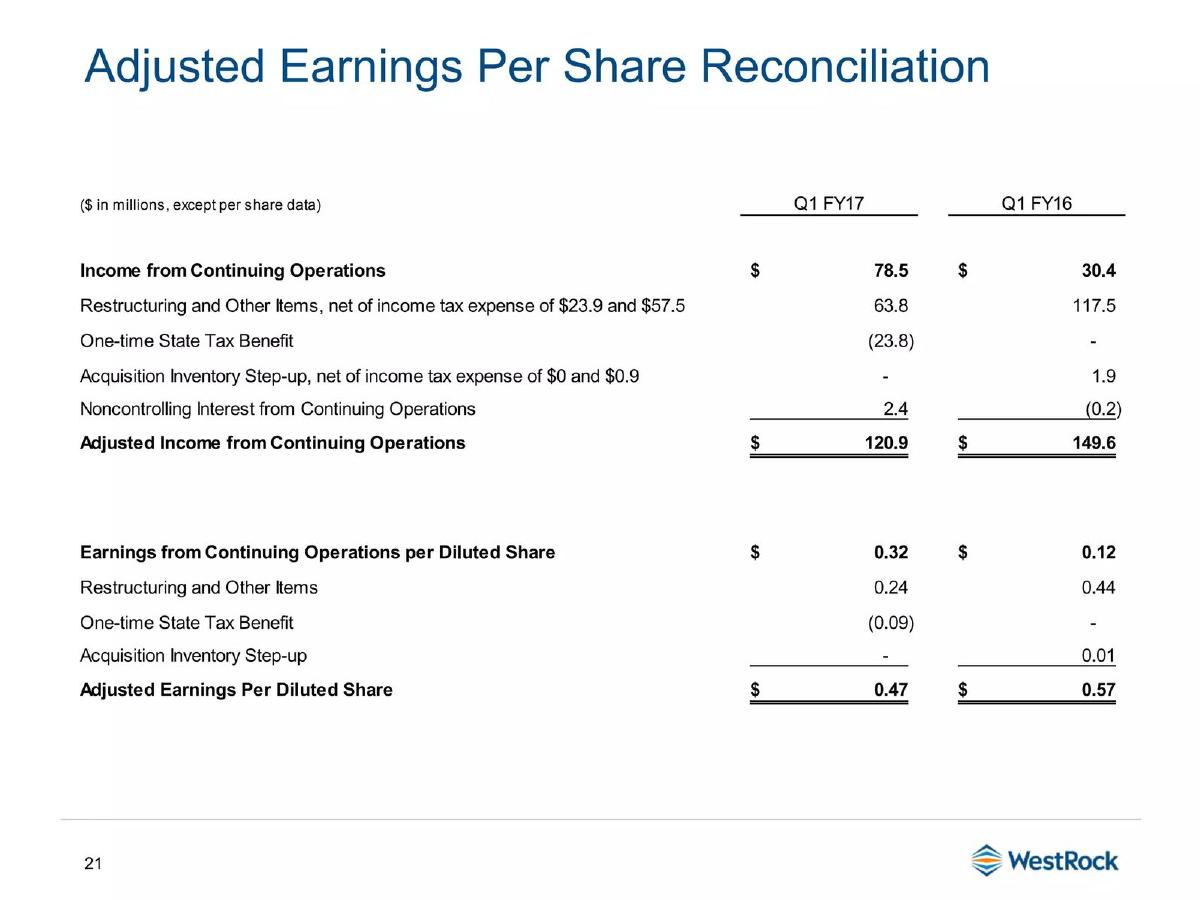
- The deck provides a bridge for Adjusted EPS, showing a move from $0.32 to $0.47 for Q1 FY17 after restructuring and tax adjustments (Slide 21).
- Operational transparency is high, with shipment data broken down by unit types like 'thousands of tons' and 'billions of square feet' (Slide 25).
- The company includes a sensitivity analysis for commodity prices, noting that a $10.00/ton increase in recycled fiber impacts annual EPS by $0.11 (Slide 33).
- Currency exposure is heavily weighted toward the USD at 84%, with CAD representing the next largest share at 7% (Slide 33).
Executive Summary: The Industrial Consolidation Playbook
The WestRock Investor Presentation from March 2017 is a technical document that reflects the complexities of a multi-billion dollar industrial merger. While many startup decks focus on vision and untapped markets, WestRock focuses on integration, synergy, and margin expansion. The deck serves as a bridge between the company's historical performance and its future as a combined entity with Multi Packaging Solutions (MPS). With over 39,000 employees and 250 operating locations, the scale described here is massive, and the deck treats that scale with appropriate mathematical rigor.
Slide 1: Title Slide
The cover is minimalist, featuring the WestRock logo and the date 'March 2017.' It establishes a professional, corporate tone immediately. There are no taglines or value propositions here; for a company of this size, the name WestRock carries the necessary weight for its intended audience of institutional analysts and shareholders.
Slide 5: WestRock Overview and Market Position
This slide is a masterclass in establishing 'Right to Win.' It breaks down FY16 Net Sales of $14.2B into two primary segments: Corrugated Packaging (55%) and Consumer Packaging (45%). The financial metrics listed are robust, showing $2,270M in Adjusted EBITDA and $1,031M in Adjusted Free Cash Flow. Crucially, it lists six 'Market-Leading Positions,' including the #1 spot in North American Consumer Paperboard and Merchandising Displays. The geographic pie chart shows a heavy concentration in North America, providing a clear context for the company's logistical footprint.
Slide 12: The Strategic Catalyst
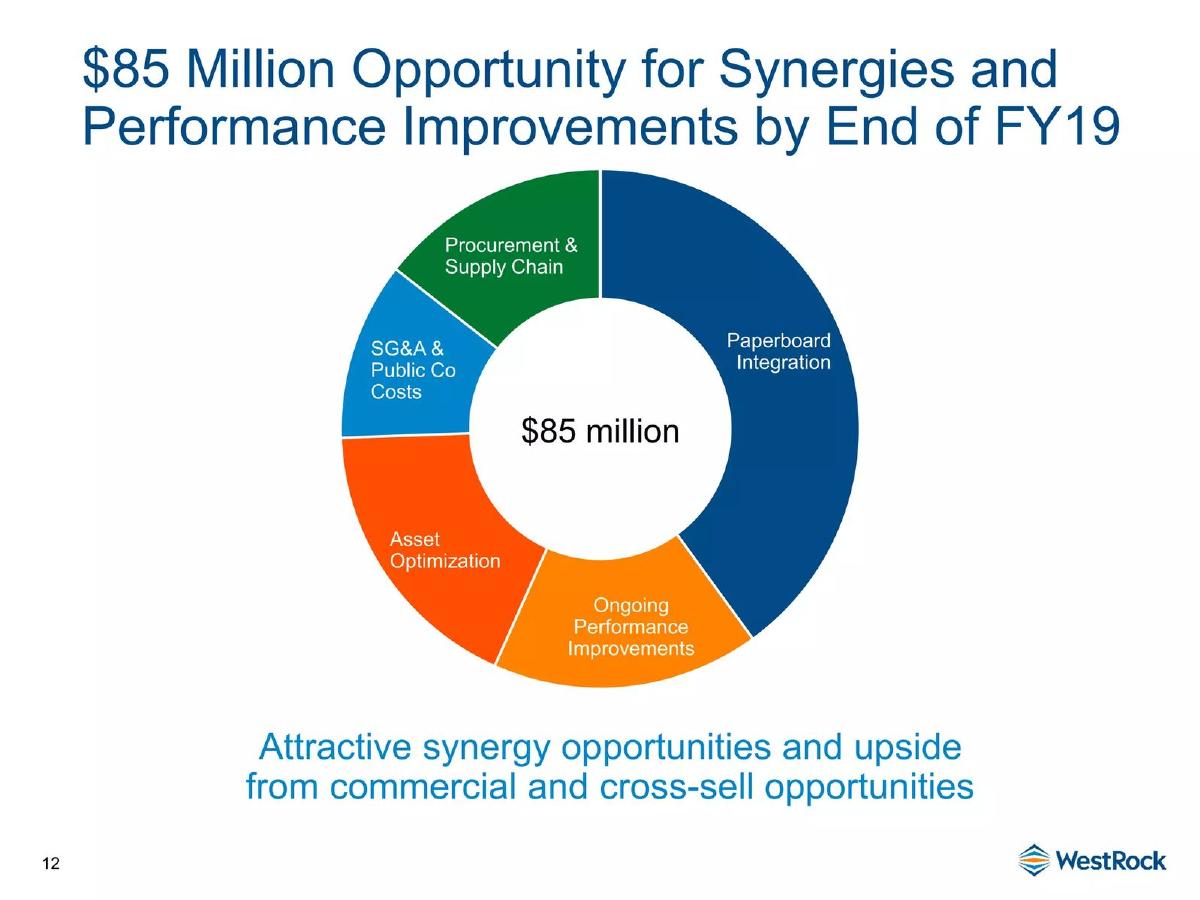
This transition slide introduces the 'Acquisition of Multi Packaging Solutions.' It marks the pivot point of the deck, moving from what WestRock was to what it is becoming. The inclusion of the MPS logo alongside WestRock signifies a brand integration strategy, not just a financial one.
Slide 13: Combined Financial Profile
This is arguably the most important slide for an investor. It provides a four-column table showing WestRock's LTM (Last Twelve Months) data, MPS's LTM data, the impact of the 'Sale of Home, Health and Beauty,' and the final pro forma 'New WestRock' figures. The math is transparent: Revenue moves to $15,187 million , and Adjusted EBITDA reaches $2,434 million . The slide also notes that the new margin is expected to be 16.0% , an improvement over WestRock's standalone 15.7%. It also addresses the 'elephant in the room' for acquisitions: debt. The estimated debt at closing is stated as $6,382 million , with a leverage ratio of 2.55x .
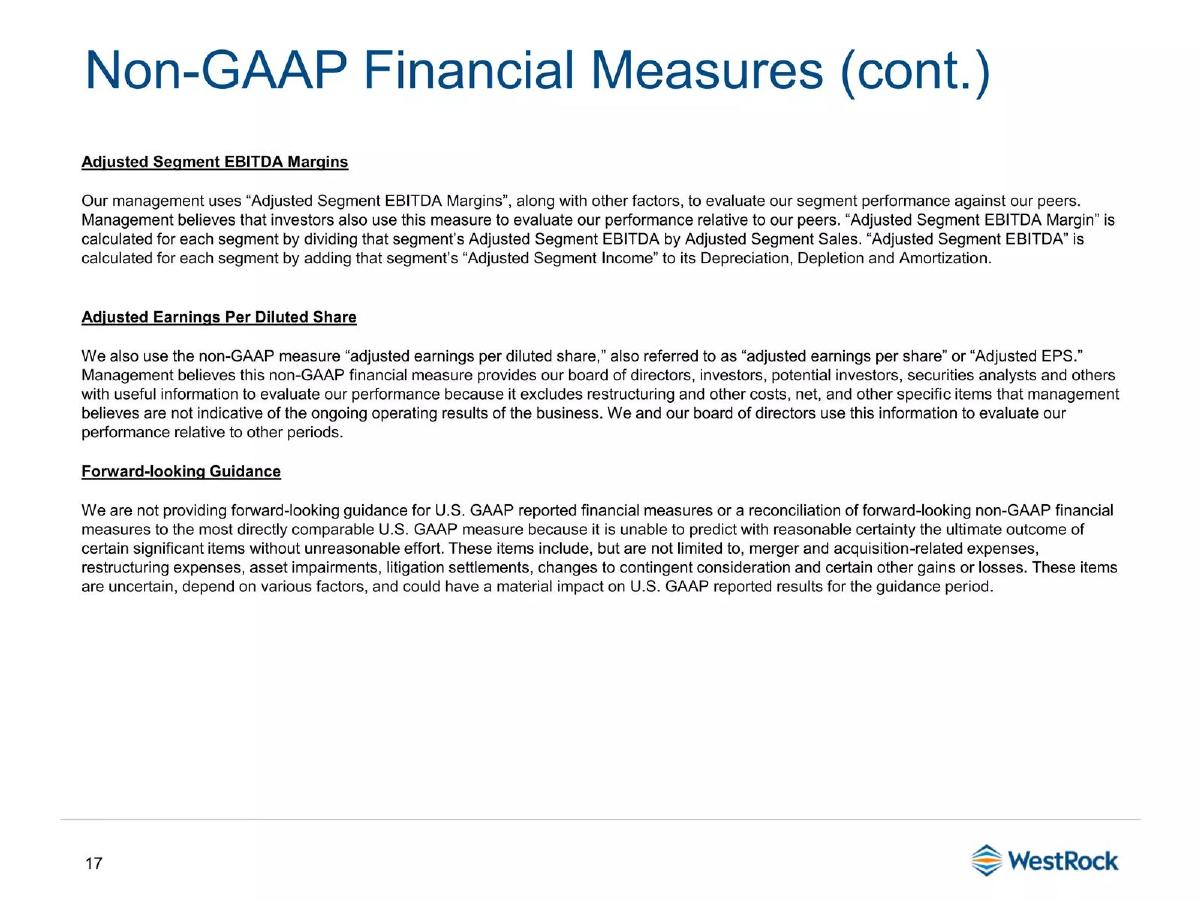
Slide 17: Non-GAAP Financial Measures (Definitions)
In a move toward total regulatory transparency, this slide defines exactly how management calculates 'Adjusted Segment EBITDA Margins' and 'Adjusted Earnings Per Diluted Share.' It explains that these measures exclude restructuring and other costs to provide a clearer view of 'ongoing operating results.' This slide is essential for preventing analysts from misinterpreting the 'adjusted' figures presented elsewhere in the deck.
Slide 21: Adjusted Earnings Per Share Reconciliation
This slide provides the 'bridge' from GAAP to Non-GAAP. It shows that while Income from Continuing Operations was $78.5 million in Q1 FY17, the 'Adjusted Income' was $120.9 million . The primary adjustments include $63.8 million in restructuring items and a ($23.8) million one-time state tax benefit. By showing the math for both the total dollar amounts and the per-share impact (moving from $0.32 to $0.47), WestRock builds credibility with sophisticated investors.
Slide 25: Q1 FY17 Packaging Shipments Results
This is a high-density data table that tracks operational volume across three years (FY15, FY16, and Q1 FY17). It tracks everything from 'Pulp Shipments' in thousands of tons to 'Corrugated Container Shipments' in billions of square feet. For example, it shows that North American Corrugated shipments were 1,951.8 thousand tons in Q1 FY17. This level of granularity allows investors to track organic volume growth versus growth through acquisition.
Slide 29: LTM Q1 FY17 Adjusted EBITDA Reconciliation
A brief but vital slide that shows the quarterly progression of Adjusted Segment EBITDA. It lists Q2 FY16 ( $530.5M ), Q3 FY16 ( $609.9M ), Q4 FY16 ( $588.8M ), and Q1 FY17 ( $490.2M ), totaling the $2,219.4M LTM figure used in earlier slides. This prevents 'cherry-picking' data by showing the full four-quarter cycle.
Slide 33: Commodity Consumption and FX Sensitivity
The final slide analyzed addresses external market risks. It lists expected annual consumption volumes for key commodities: 5 million tons of recycled fiber, 31 million tons of wood, and 87 million gallons of diesel, among others. The 'Sensitivity Analysis' table is a highlight, explicitly stating that a +$10.00/ton increase in the price of recycled fiber results in a ($0.11) impact on annual EPS. It also breaks down revenue by transaction currency, showing that 84% of revenue is in USD, which helps investors model foreign exchange risk.
What WestRock Does Well
WestRock excels at quantitative justification . Every strategic claim—whether it is about market leadership or the benefits of an acquisition—is backed by a specific table or chart. They do not ask the investor to take their word for it; they provide the raw data and the reconciliation formulas to prove it. The use of pro forma modeling (Slide 13) is particularly effective, as it clearly shows the 'before and after' of a complex corporate restructuring, including the divestiture of a business unit. Furthermore, the inclusion of sensitivity analysis (Slide 33) demonstrates a high level of operational control and an understanding of the macroeconomic levers that affect their bottom line.
What is Missing from the Deck
As a public company investor presentation, this deck omits several elements common in startup pitches. There is no team slide in this selection, likely because the executive leadership is already well-known to the market. There is also no 'Problem' slide ; WestRock operates in a mature industry where the 'problem' (the need for packaging) is a given. Additionally, the deck lacks a long-term vision or roadmap beyond the immediate integration of MPS. While it focuses heavily on the 'how' of the next 12 months, it spends less time on the 'where' of the next five years, such as potential R&D into sustainable packaging materials which was becoming a major trend in 2017.
Founder Takeaways: Copy the Transparency, Not the Density
Founders can learn a great deal from WestRock’s financial honesty . If your startup is using 'Adjusted' metrics (like Contribution Margin or Burn Rate excluding one-time legal fees), you should provide a reconciliation slide exactly like Slide 21. It builds immense trust to show the 'raw' number alongside the 'adjusted' number. However, founders should avoid the visual density of Slide 25. While appropriate for a public company reporting to analysts, a startup pitch should never feature a table with 100+ data points. Instead, take the 'Market-Leading Positions' approach from Slide 5: use clear, bold icons and rankings to show why you are winning in your specific niche.
Frequently asked questions
- What was the primary purpose of the WestRock 2017 presentation?
- The presentation was designed to brief investors on the financial and operational implications of the Multi Packaging Solutions (MPS) acquisition. It provides a pro forma view of the 'New WestRock,' including the impact of divesting the Home, Health, and Beauty business. The goal was to demonstrate how the combined entity would achieve higher margins (16.0%) and manage a total debt load of $6.382 billion.
- How does WestRock define its market leadership?
- WestRock uses specific regional and product-category rankings to define its moat. According to slide 5, they hold the #1 position in North American Consumer Paperboard and Merchandising Displays. They also claim #2 positions in North American Folding Carton, North American Containerboard, and Corrugated Packaging in both North America and Brazil, highlighting their scale across the Western Hemisphere.
- What financial metrics does the deck prioritize?
- Unlike early-stage decks that focus on growth, WestRock focuses on stability and cash flow. Key metrics include Adjusted EBITDA ($2.27 billion in FY16), Adjusted Free Cash Flow ($1.031 billion), and Dividend Payout ($381 million). The deck also places significant emphasis on the Leverage Ratio, which was projected to rise to 2.55x following the MPS acquisition.
- How transparent is the deck regarding non-GAAP figures?
- The deck is exceptionally transparent, dedicating multiple slides (17, 21, 29) to reconciliations. It explicitly defines how Adjusted Segment EBITDA Margins and Adjusted EPS are calculated, stripping out one-time costs like restructuring, state tax benefits, and acquisition inventory step-ups. This level of detail is standard for public companies to ensure compliance and investor trust.
- What operational risks are addressed in the presentation?
- The presentation addresses supply chain and macroeconomic risks through a detailed commodity and FX sensitivity analysis on slide 33. It tracks the consumption of 31 million tons of wood and 65 billion cubic feet of natural gas, providing investors with a direct calculation of how price fluctuations in these specific commodities will impact the bottom-line Earnings Per Share.