WestRock, a global leader in consumer and corrugated packaging, utilized this May 2018 investor presentation to detail its growth trajectory and the strategic acquisition of KapStone. The deck is characterized by extreme financial transparency, dedicating nearly half of its length to non-GAAP reconciliations and technical appendices. Key highlights include a projected EBITDA CAGR of over 11% through FY22 and a specific breakdown of $200 million in run-rate cost synergies from the KapStone deal. Unlike early-stage startup decks that focus on 'the dream,' this presentation focuses on the 'mecha…
Key takeaways
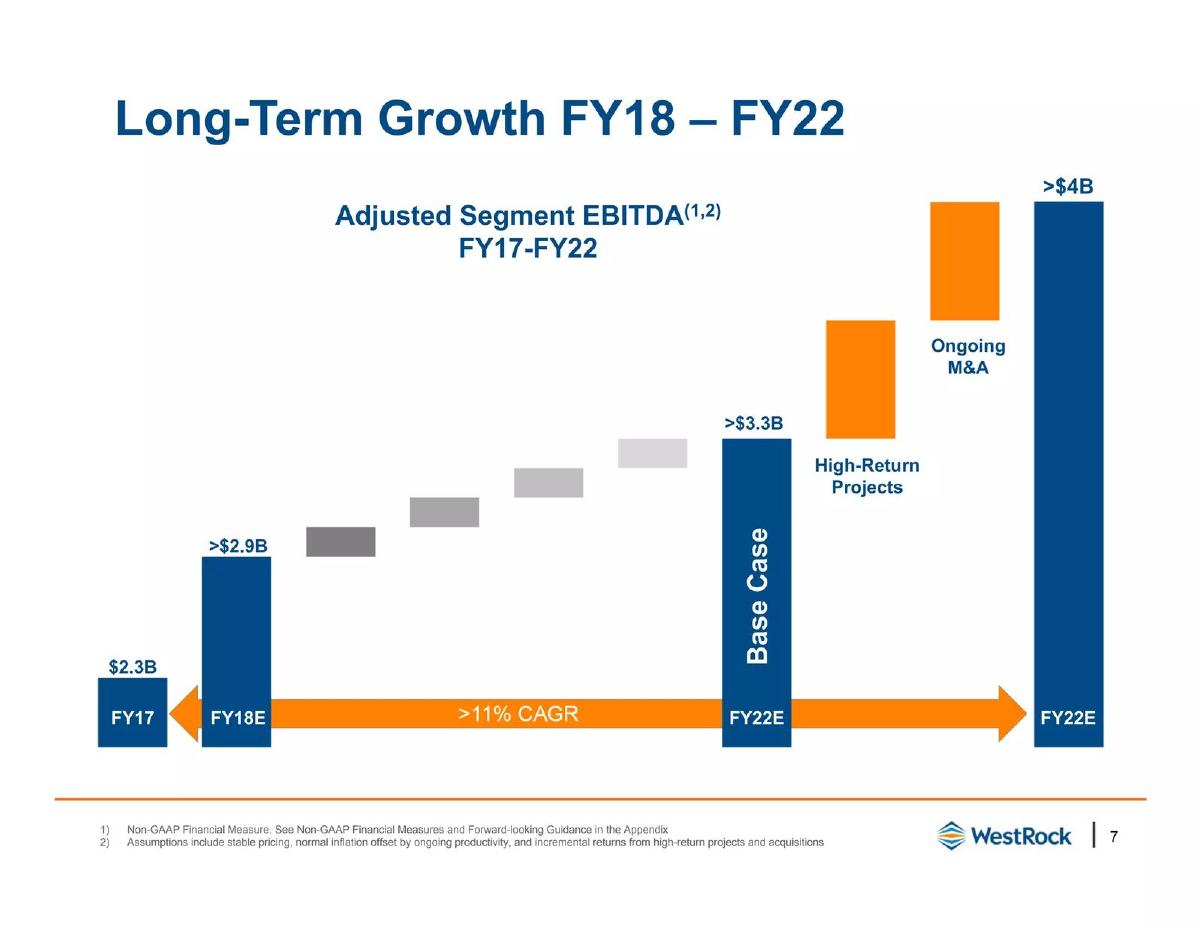
- The company projects a long-term growth target exceeding $4 billion in Adjusted Segment EBITDA by FY22, representing an 11% CAGR from FY17 (Slide 7).
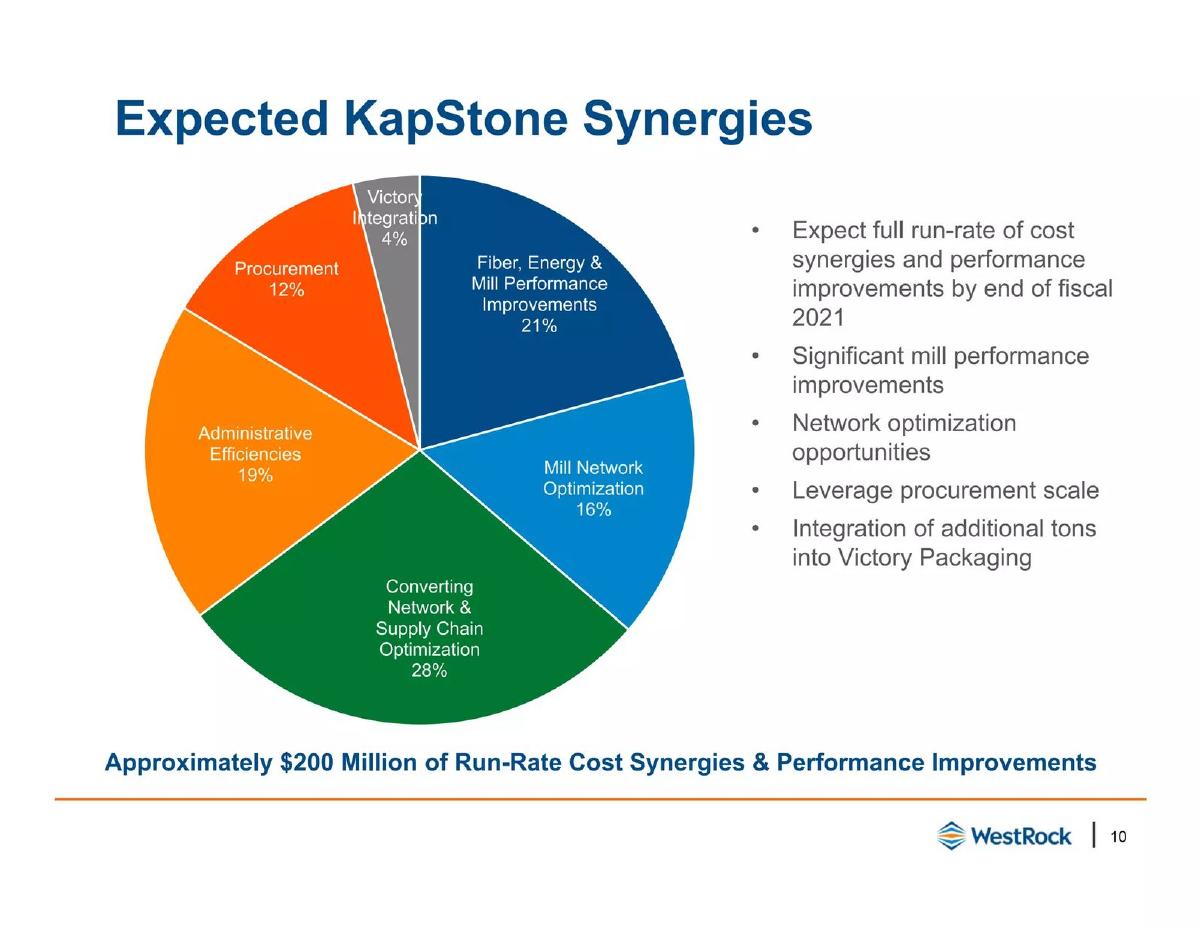
- WestRock identifies $200 million in run-rate cost synergies from the KapStone acquisition, with 28% coming from supply chain optimization (Slide 10).
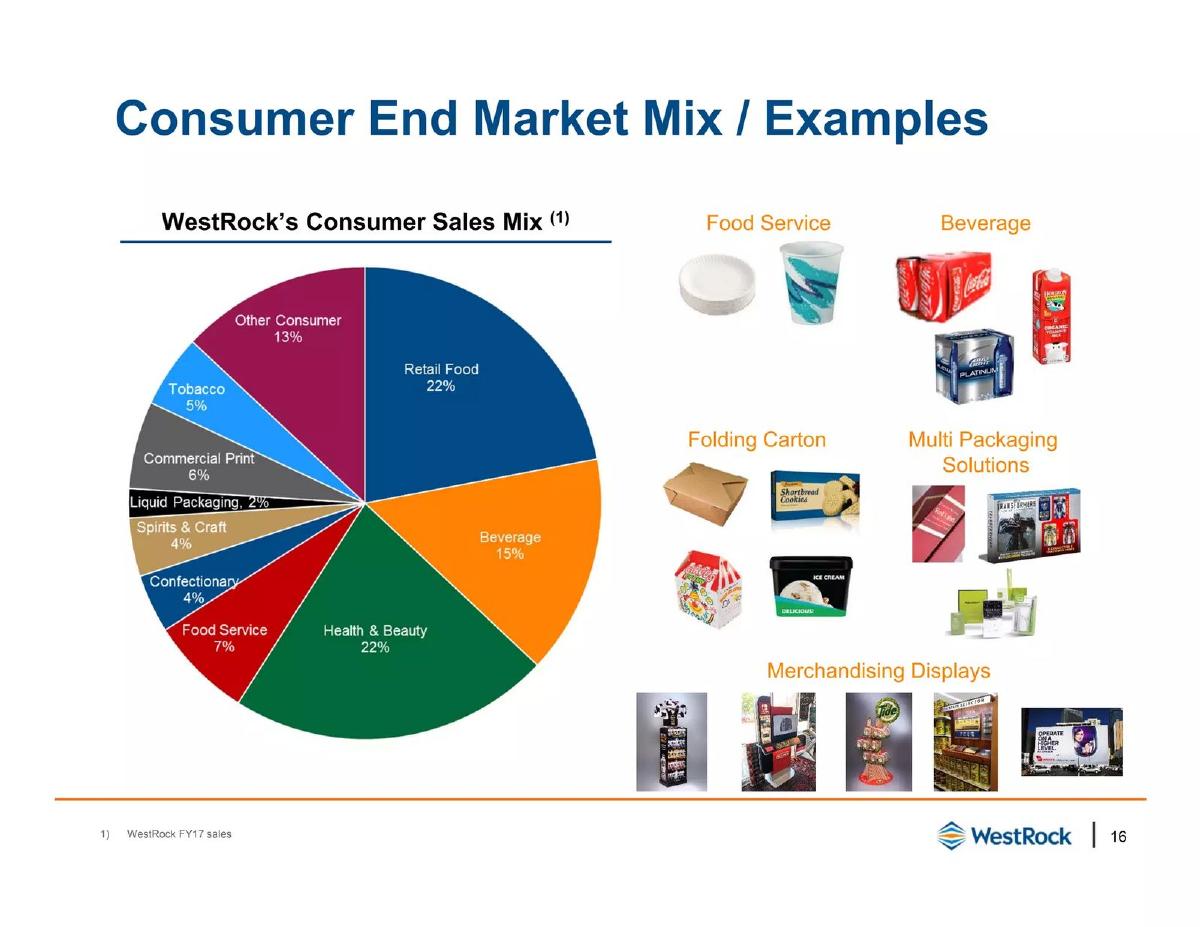
- The consumer sales mix is highly diversified, with Retail Food (22%) and Health & Beauty (22%) serving as the largest segments (Slide 16).
- A significant portion of the deck is dedicated to legal disclaimers and the definition of non-GAAP measures like Adjusted EPS and Adjusted Operating Cash Flow (Slides 4, 19).
- Financial reporting is segmented into Corrugated Packaging, Consumer Packaging, and Land and Development, providing granular margin data for each (Slide 25).
- The presentation uses a 'Base Case' vs. 'High-Return Projects' bridge to show a clear path from $3.3 billion to over $4 billion in EBITDA (Slide 7).
- LTM Credit Agreement EBITDA is reported at $2,671.2 million as of Q2 FY18, including $298.9 million in permitted charges (Slide 28).
- The deck omits a traditional 'Team' slide, common in public company presentations where management is already well-known to the street.
Introduction and Legal Framework
Slide 1: Title Slide
The presentation opens with the WestRock logo and a clear 'Investor Presentation' subtitle dated May 2018. The branding is professional and minimalist, typical of a Fortune 500 industrial firm. The visual language suggests stability and corporate scale.
Slide 4: Disclaimer and Non-GAAP Financial Measures
This is a standard but essential slide for a public company. It explicitly states that the presentation contains forward-looking statements and that the company uses non-GAAP measures to evaluate performance. It directs investors to the Appendix for reconciliations, establishing a tone of regulatory compliance and financial rigor.
Growth Strategy and M&A Synergies
Slide 7: Long-Term Growth FY18 – FY22
This is the 'anchor' slide of the presentation. It provides a visual bridge for Adjusted Segment EBITDA from a baseline of $2.3 billion in FY17 to a target of >$4 billion in FY22. The slide identifies a >11% CAGR. Notably, it separates growth into three distinct phases: the 'Base Case' ($3.3B), 'High-Return Projects,' and 'Ongoing M&A.' This transparency allows investors to model the risk associated with each growth lever.
Slide 10: Expected KapStone Synergies
WestRock breaks down the $200 million in expected run-rate cost synergies from the KapStone acquisition. The pie chart is highly specific: 28% from Converting Network & Supply Chain, 21% from Fiber/Energy/Mill Performance, 19% from Administrative Efficiencies, 16% from Mill Network Optimization, 12% from Procurement, and 4% from Victory Integration. This level of detail is designed to give analysts concrete numbers to track during quarterly earnings calls.
Market Mix and Operational Footprint
Slide 16: Consumer End Market Mix / Examples
This slide serves to prove the company's resilience through diversification. The 'Consumer Sales Mix' pie chart shows a balanced portfolio: Retail Food (22%), Health & Beauty (22%), Beverage (15%), and smaller segments like Tobacco (5%) and Food Service (7%). The right side of the slide uses product photography (Coca-Cola, Bud Light, Tide) to ground the abstract financial data in recognizable household brands, emphasizing WestRock's role as a critical infrastructure provider for the CPG industry.
Financial Reconciliations and Technical Data
Slide 19: Non-GAAP Financial Measures Definitions
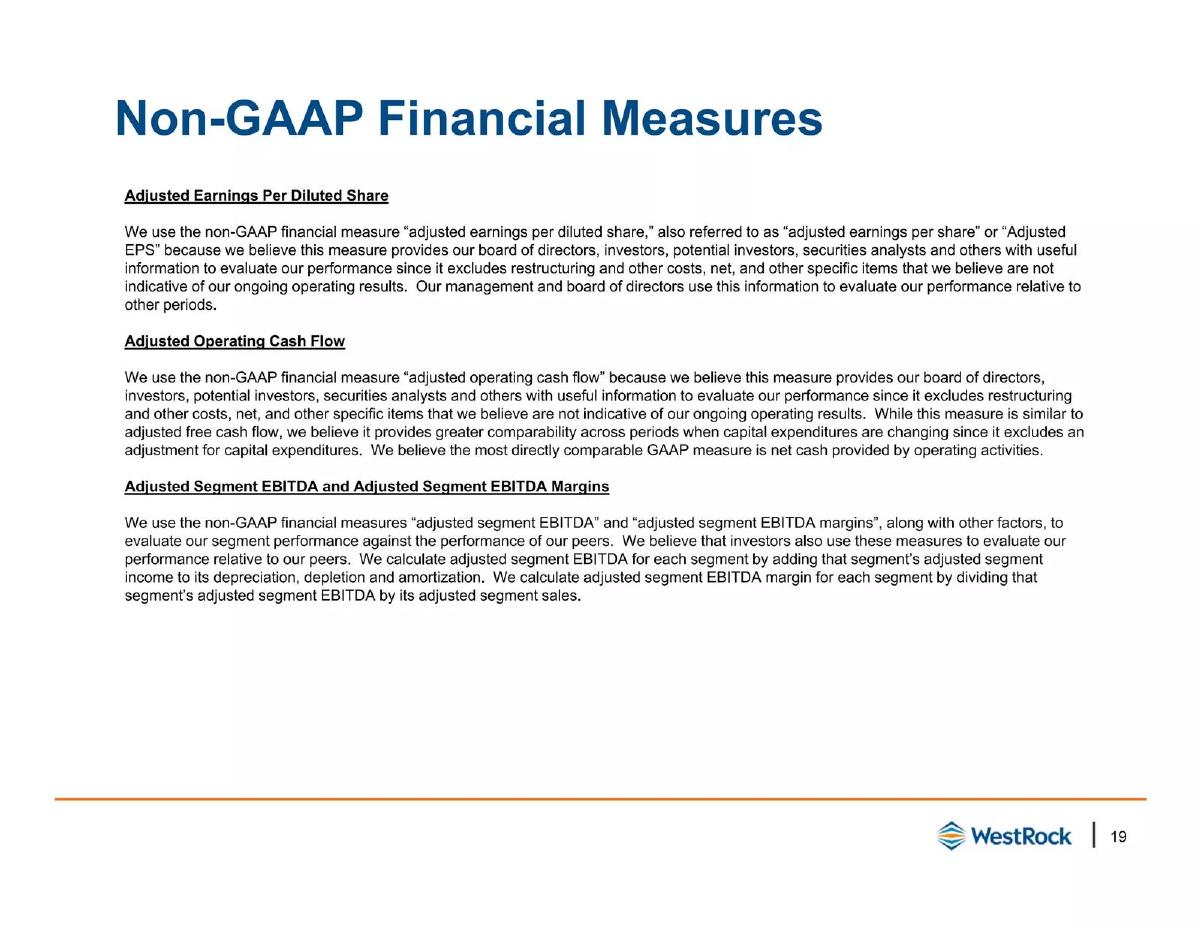
The deck moves into a technical phase, defining Adjusted EPS, Adjusted Operating Cash Flow, and Adjusted Segment EBITDA. The text explains that these measures exclude 'restructuring and other costs, net' to provide a clearer picture of ongoing operating results. This is a defensive slide intended to preempt questions about why GAAP numbers might look different from management's narrative.
Slide 22: Adjusted Net Income Reconciliation
This slide provides a line-by-line reconciliation for Q2 FY18 and Q2 FY17. It shows GAAP results ($224.5M Net of Tax for Q2 FY18) and adjusts for items like 'Restructuring and other items' ($23.5M) and 'Impact of Tax Cuts and Jobs Act' (-$31.5M) to arrive at an Adjusted Net Income of $215.8M. This level of transparency is the gold standard for investor relations.
Slide 25: Adjusted Segment EBITDA and Other Items
Here, the company breaks down performance by business unit: Corrugated Packaging, Consumer Packaging, and Land and Development. For Q2 FY17, it shows Corrugated Packaging generated $305.3M in Adjusted Segment EBITDA at a 15.3% margin, while Consumer Packaging generated $235.1M at a 15.1% margin. This allows investors to see which side of the business is driving the most value and where margins are expanding or contracting.
Slide 28: LTM Credit Agreement EBITDA
This slide is specifically for debt holders and credit analysts. It calculates the 'Last Twelve Months' (LTM) EBITDA as defined by their credit agreements, totaling $2,671.2 million. It adds back non-cash items like Depreciation & Amortization ($1,202.9M) and 'Additional Permitted Charges' ($298.9M) to the Consolidated Net Income of $1,879.9M. This is a vital metric for assessing the company's leverage and borrowing capacity.
What Works in This Deck
Granular Synergy Breakdown: By assigning specific percentages to M&A savings (Slide 10), WestRock moves beyond vague promises of 'efficiency' and gives the market a scorecard to measure them by.
The Growth Bridge: Slide 7 is exceptionally effective. It doesn't just show a line going up; it shows the components of that upward movement, distinguishing between what is already in motion (Base Case) and what requires further execution (M&A and Projects).
Extreme Financial Transparency: The inclusion of detailed reconciliation tables (Slides 22, 25, 28) builds significant credibility with institutional investors and analysts who need to build their own models.
What Is Missing from This Deck
The Human Element: There is no team slide. While common for established public companies, a slide highlighting the key executives responsible for the KapStone integration would have added a layer of accountability.
Competitive Landscape: The deck operates in a vacuum. There is no mention of competitors like International Paper or Packaging Corporation of America. While WestRock focuses on its own internal metrics, a slide on market share or relative margin positioning would have provided helpful context.
ESG and Sustainability: In 2018, ESG was becoming a major investor focus. For a company in the paper and packaging industry, the absence of a slide addressing sustainable forestry or plastic-to-paper transition (beyond the 'Fiber' mention on Slide 10) is a missed opportunity to appeal to impact-focused funds.
What a Founder Should Copy
The 'Base Case' vs. 'Upside' Model: Founders often present one aggressive growth forecast. Copying WestRock’s approach of showing a 'Base Case' and then layering on specific initiatives to reach a 'Target' makes the final number feel much more achievable and grounded in reality.
Visualizing the Mix: Slide 16 is a perfect template for any company with multiple revenue streams. Using a pie chart alongside actual product logos or use-case icons makes a complex business model instantly understandable to a generalist investor.
Defining Your Own Metrics: If your industry has unique KPIs, don't just list them. Copy Slide 19’s approach of providing a clear, text-based definition of why those metrics matter and how they are calculated. This prevents confusion later in the due diligence process.
Frequently asked questions
- What is the primary growth driver identified in the WestRock deck?
- The primary driver is a combination of organic 'High-Return Projects' and strategic M&A, specifically the KapStone integration. Slide 7 illustrates that while the 'Base Case' leads to $3.3 billion in EBITDA, ongoing M&A and specific projects are required to bridge the gap to the >$4 billion FY22 target.
- How does WestRock justify its use of non-GAAP financial measures?
- On Slide 19, WestRock explains that measures like Adjusted Segment EBITDA provide a better evaluation of performance against peers by excluding non-recurring items like restructuring costs. They argue these metrics offer 'greater comparability across periods' when capital expenditures or tax laws change significantly.
- What specific areas yield the most savings in the KapStone acquisition?
- According to Slide 10, the largest synergy bucket is 'Converting Network & Supply Chain Optimization' at 28%. This is followed by 'Fiber, Energy & Mill Performance Improvements' at 21%, suggesting that the value of the deal lies heavily in operational logistics and raw material efficiency.
- How diverse is WestRock's revenue stream across consumer markets?
- Highly diverse. Slide 16 shows that no single consumer end-market accounts for more than 22% of sales. By spreading risk across Food, Beverage, Health & Beauty, and Tobacco, the company insulates itself against sector-specific downturns in the retail landscape.
- What is the significance of the Adjusted Net Income Reconciliation slide?
- Slide 22 is crucial for institutional trust. It shows the bridge from a GAAP Net Income of $224.5 million to an Adjusted Net Income of $215.8 million for Q2 FY18. By showing exactly how items like 'Impact of Tax Cuts and Jobs Act' ($31.5 million) are handled, they prevent accusations of 'earnings management.'