The Watts Water Technologies presentation from March 2018 serves as a template for mature industrial companies communicating a 'pivot to growth.' At the time of this deck, Watts was a $1.5B global entity with a heavy concentration in the Americas (65% of revenue). The narrative centers on a completed multi-year transformation, moving from footprint optimization and portfolio rationalization toward a goal of 14%+ adjusted operating margins by 2020. The deck is notable for its granular breakdown of end markets—ranging from hospitality to healthcare—and a highly disciplined M&A framework. While…
Key takeaways
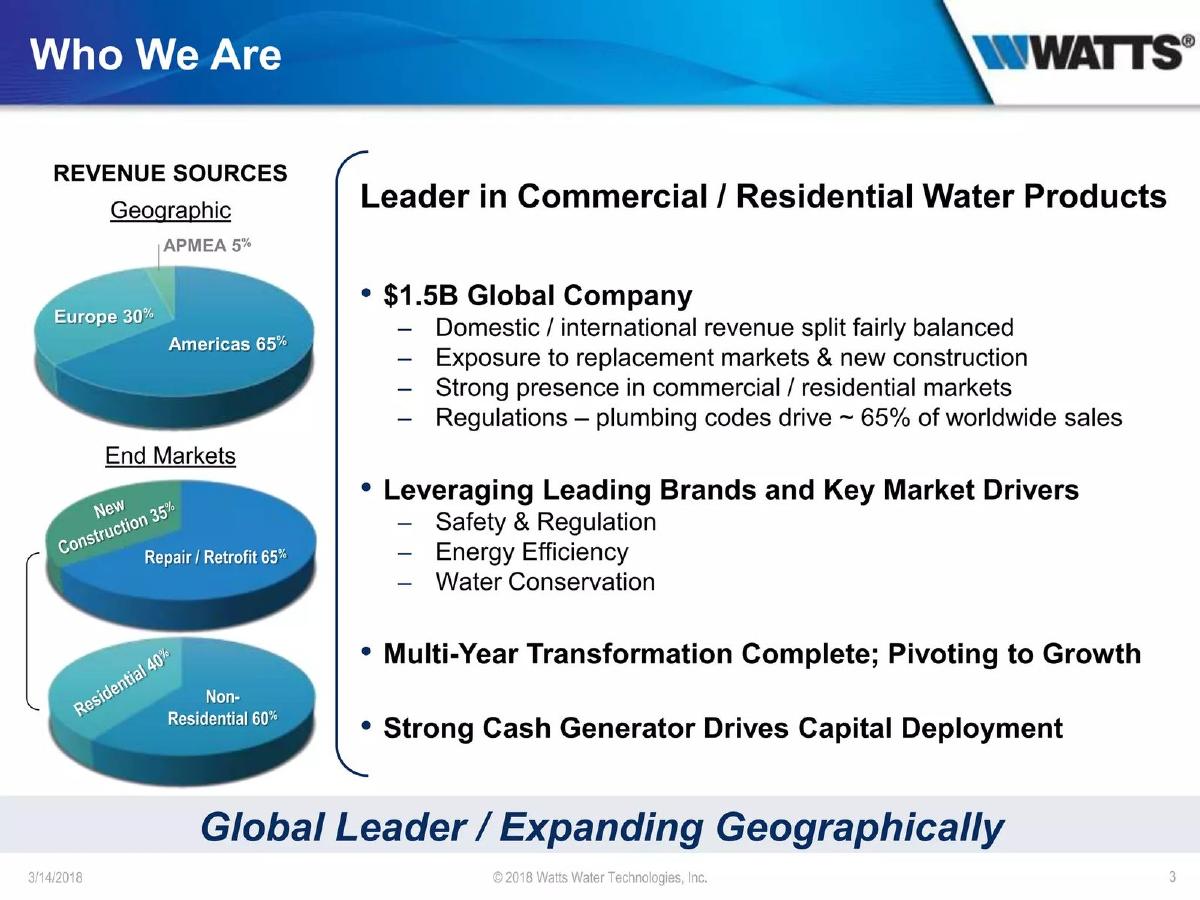
- Watts identifies as a $1.5B global company with 65% of revenue coming from the Americas and 30% from Europe (Slide 3).
- The company claims that plumbing code regulations drive approximately 65% of worldwide sales, providing a stable regulatory moat (Slide 3).
- Revenue is balanced between new construction (35%) and repair/retrofit (65%), suggesting resilience against housing market cycles (Slide 3).
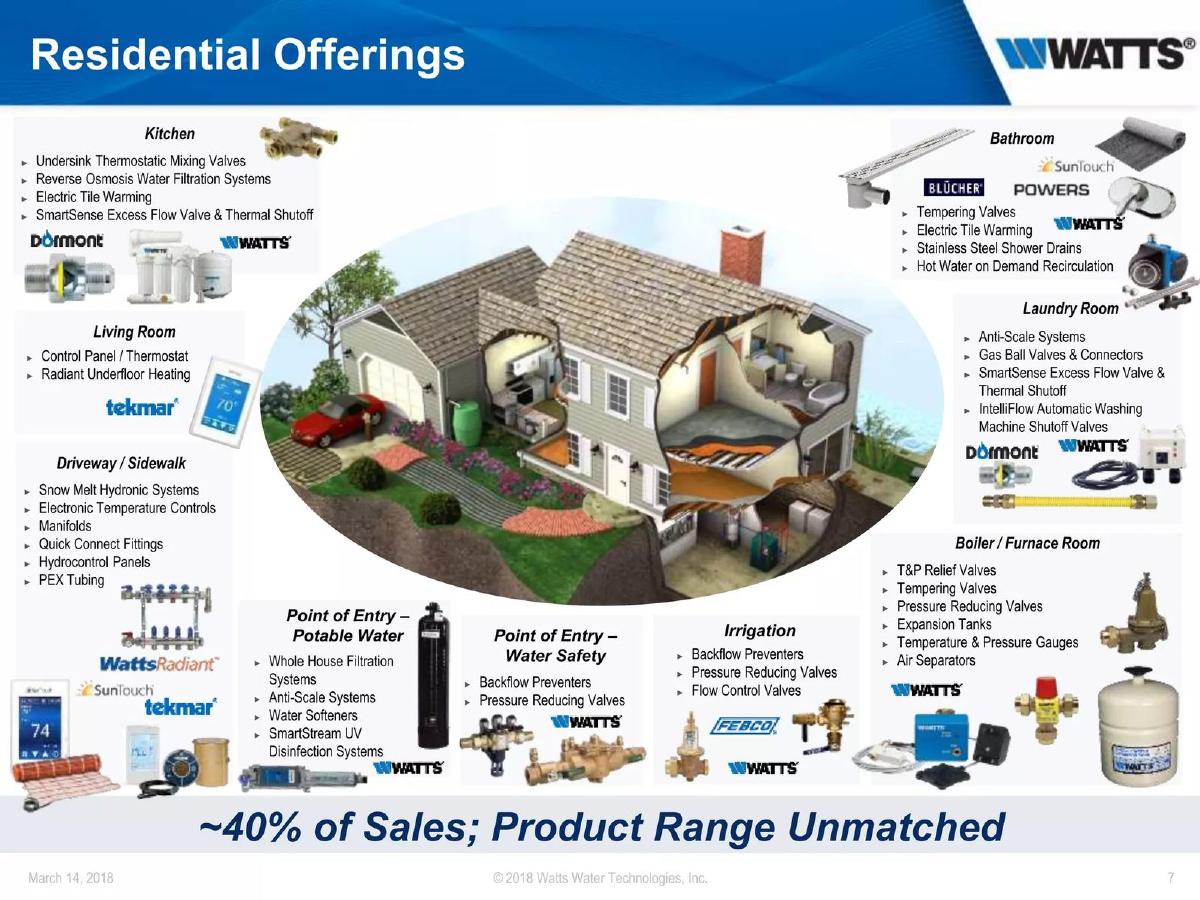
- Residential offerings account for 40% of total sales, supported by a wide product range including filtration, safety valves, and hydronic systems (Slide 7).
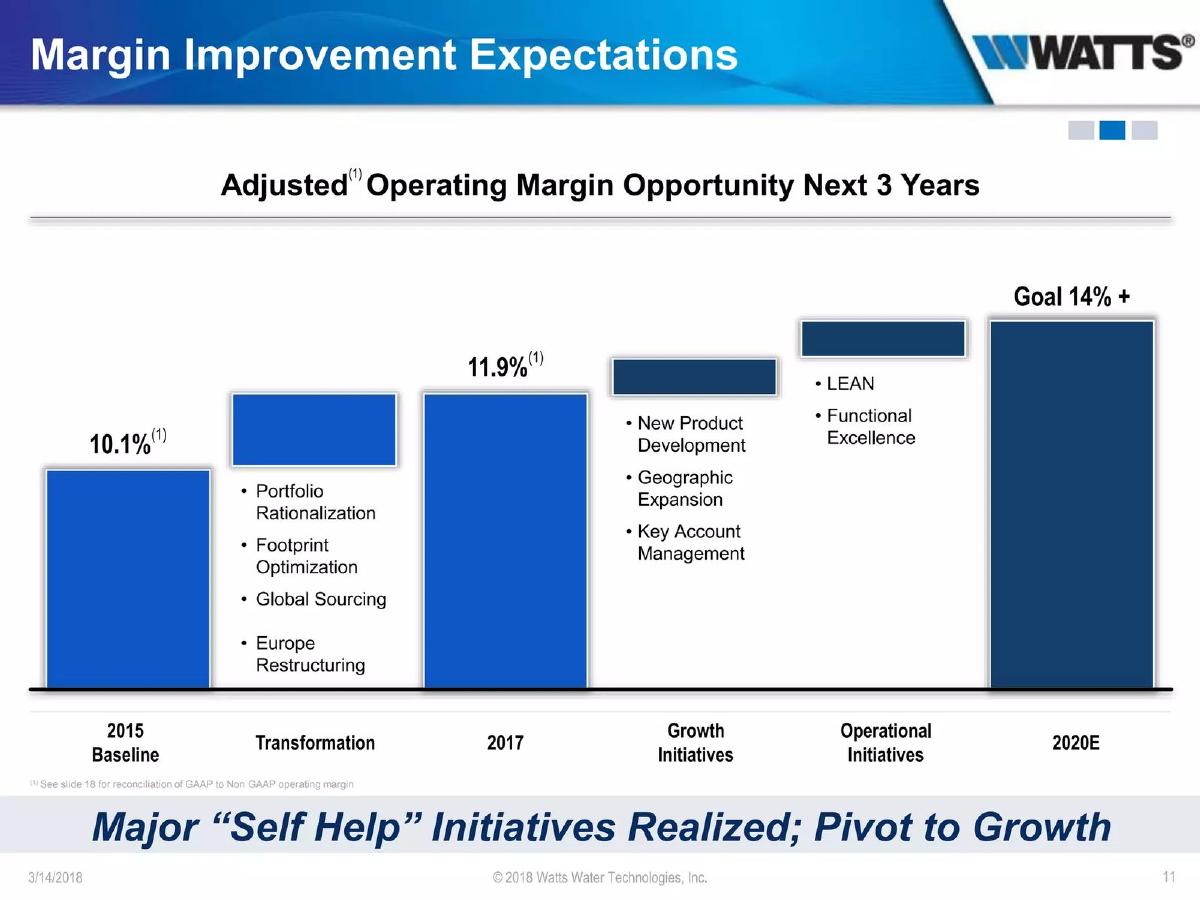
- A clear margin improvement roadmap shows a jump from a 10.1% baseline in 2015 to a 2020 target of 14%+ (Slide 11).
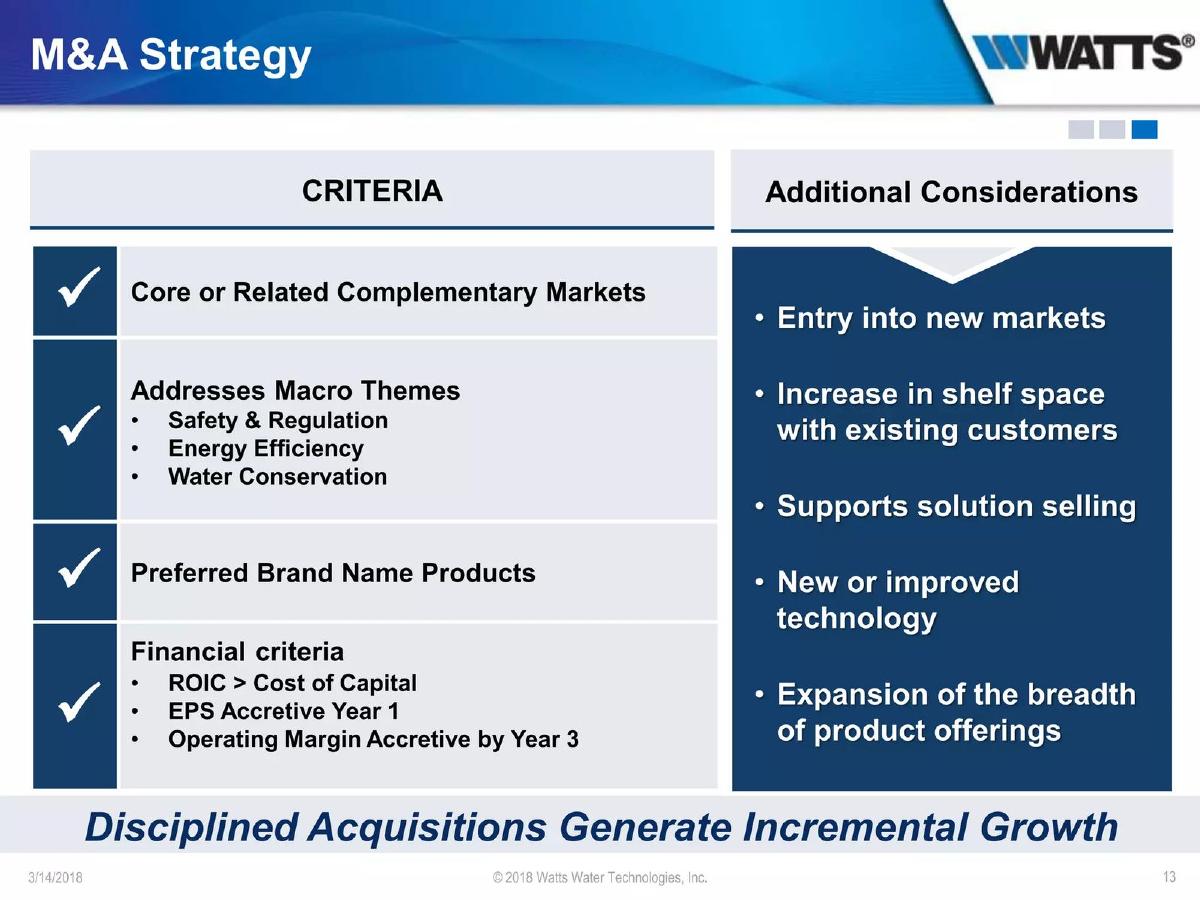
- The M&A strategy is strictly defined by financial criteria, requiring acquisitions to be EPS accretive in Year 1 and operating margin accretive by Year 3 (Slide 13).
- Regional organic growth outlooks for 2018 were modest, ranging from 1-3% in Europe to 7-10% in the APMEA region (Slide 15).
- The company maintains a disciplined balance sheet, reporting a net debt to capitalization ratio of 20.7% as of December 31, 2017 (Slide 19).
Introduction: The Industrial Giant's Playbook
The Watts Water Technologies investor presentation from March 14, 2018, is a quintessential example of a mature, publicly-traded industrial company communicating with the street. Unlike startup decks that focus on 'disruption' and 'TAM,' Watts focuses on 'optimization' and 'capital deployment.' The deck is structured to prove that the company has moved past a period of internal restructuring and is now a lean, cash-generating machine. With $1.5 billion in revenue, the narrative is less about proving the product works and more about proving the management team can squeeze more margin out of every dollar earned.
Slide 1: Title and Visual Identity
The cover slide establishes the industrial nature of the business through a collage of high-resolution imagery. It features commercial boiler systems, water conservation (hands catching water), construction workers, and heavy-duty valves. The branding is consistent, using the blue and white color palette of the Watts logo. This slide serves to immediately ground the investor in the physical reality of the business: pipes, valves, and infrastructure.
Slide 3: Who We Are - The $1.5B Foundation
This is the 'anchor' slide of the deck. It defines Watts as a $1.5B Global Company . The slide uses three 3D pie charts to break down revenue sources. Geographically , the Americas dominate at 65%, followed by Europe at 30% and APMEA at 5%. The End Markets chart is particularly important for industrial investors, showing that 65% of revenue comes from Repair/Retrofit, which is generally more stable than the 35% coming from New Construction. Finally, the Residential/Non-Residential split is 40/60. The slide also introduces a key competitive moat: Regulations . It states that plumbing codes drive approximately 65% of worldwide sales, implying that their products are not just wanted, but legally required.
Slide 5: Attractive End Markets
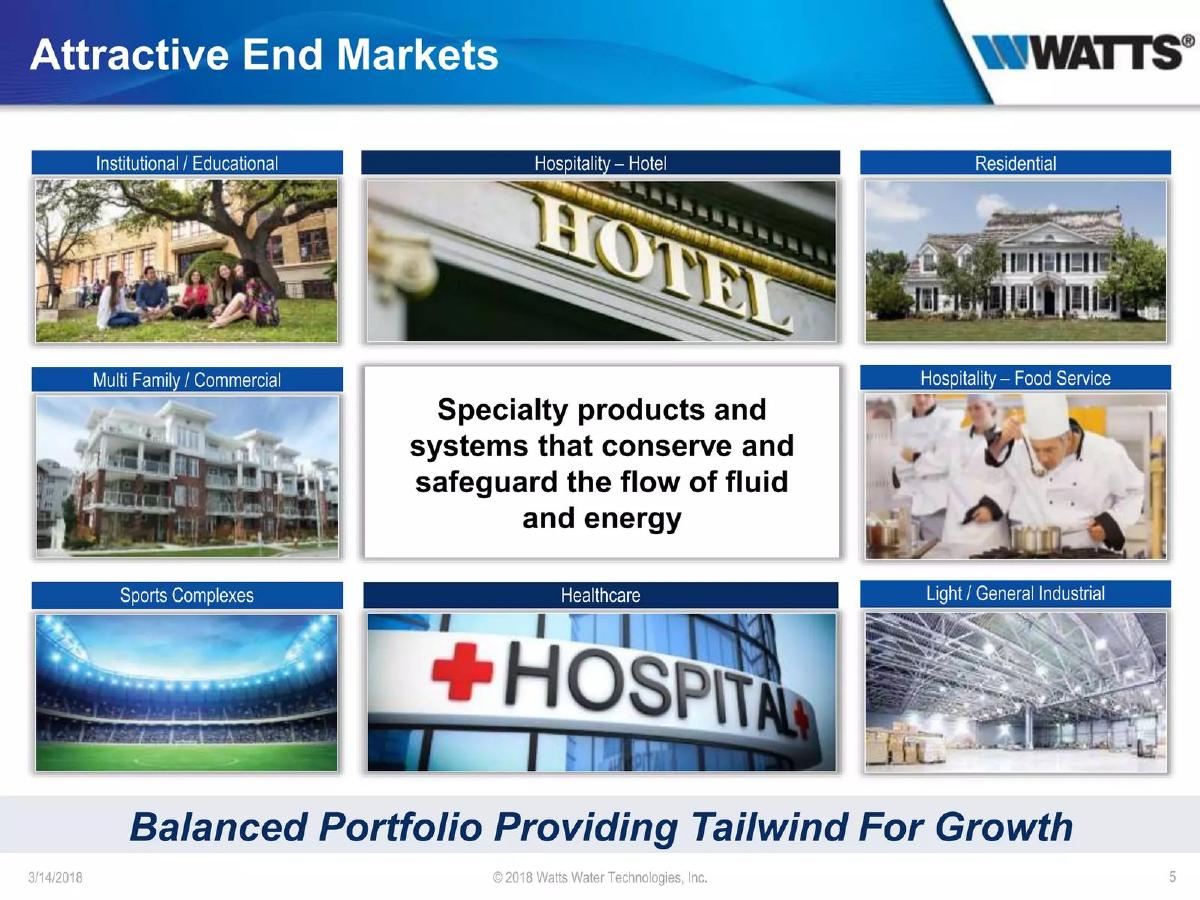
Slide 5 expands on the versatility of the product line. It lists eight distinct sectors: Institutional/Educational, Hospitality (Hotels and Food Service), Residential, Multi-Family/Commercial, Sports Complexes, Healthcare, and Light/General Industrial. The central thesis stated here is that Watts provides "Specialty products and systems that conserve and safeguard the flow of fluid and energy." By showing a hospital, a stadium, and a hotel, Watts is signaling that their total addressable market is essentially every modern building on earth.
Slide 7: Residential Offerings - The Product Deep Dive
This slide uses a cutaway diagram of a house to visualize where Watts products live. It is a dense slide, listing dozens of products across the Kitchen, Living Room, Driveway, Bathroom, Laundry Room, and Boiler Room. Key brands like Dormont, Tekmar, SunTouch, and Febco are highlighted. The slide notes that residential sales account for ~40% of Sales and claims a "Product Range Unmatched." This level of detail is intended to show the breadth of their catalog and the difficulty a new competitor would face in trying to replicate their shelf space.
Slide 9: Watts Strategic Framework
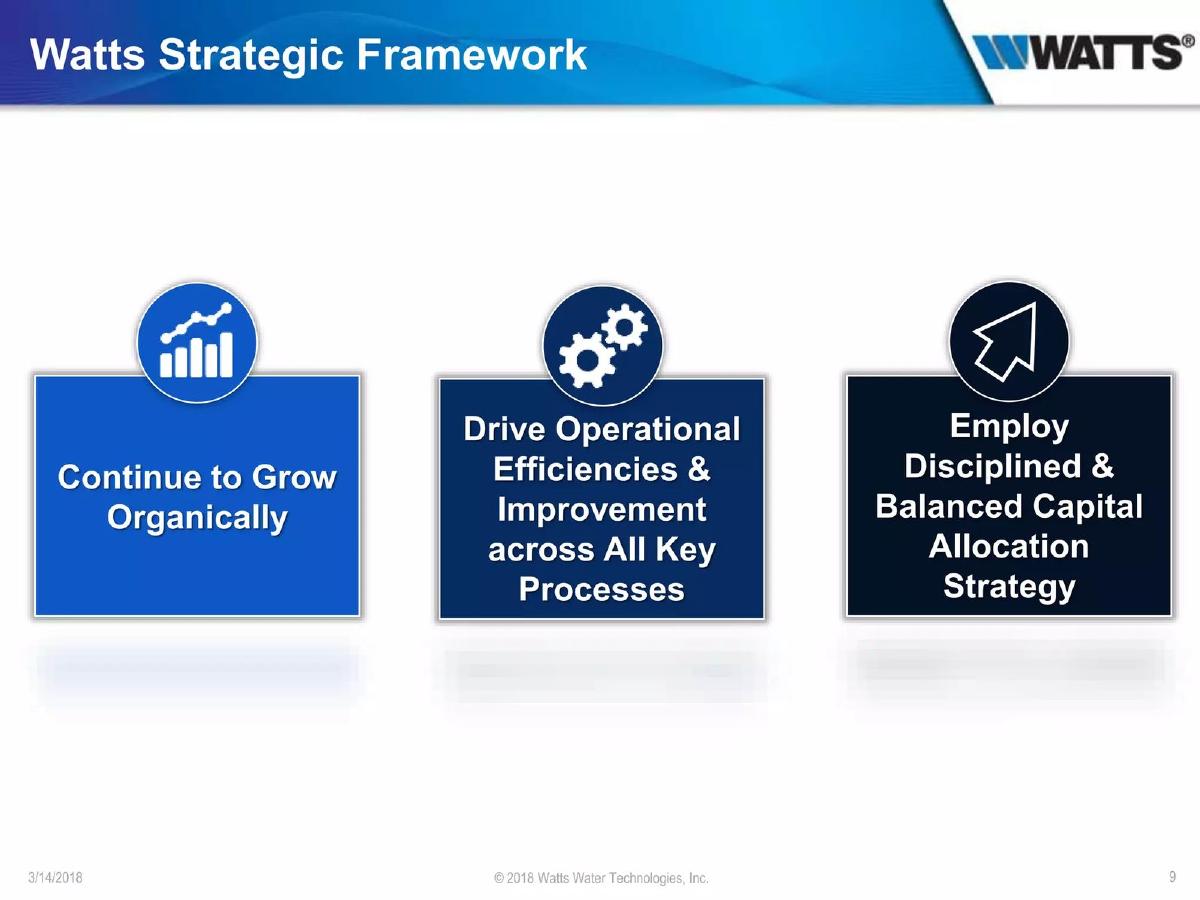
This is a high-level conceptual slide that outlines the three pillars of their strategy: Continue to Grow Organically , Drive Operational Efficiencies , and Employ Disciplined & Balanced Capital Allocation Strategy . It is a standard corporate strategy slide, but it sets the stage for the financial data that follows. It tells the investor exactly what the management team is focused on every day.
Slide 11: Margin Improvement Expectations
Slide 11 is the most critical slide for a 'transformation' story. It shows a bar chart of Adjusted Operating Margin . The baseline in 2015 was 10.1%. By 2017, they reached 11.9%. The goal for 2020 is 14% + . The slide breaks down how they got there (Transformation: Portfolio Rationalization, Footprint Optimization) and how they will get to the goal (Growth Initiatives: New Product Development; Operational Initiatives: LEAN). This provides a clear scorecard for investors to hold management accountable.
Slide 13: M&A Strategy
For a company with strong cash flow, M&A is a primary growth lever. Watts uses Slide 13 to define their 'Disciplined Acquisitions.' They list four hard criteria: Core or Related Complementary Markets, Addressing Macro Themes (Safety, Efficiency, Conservation), Preferred Brand Name Products, and strict Financial Criteria . The financial requirements are rigid: ROIC > Cost of Capital , EPS Accretive Year 1 , and Operating Margin Accretive by Year 3 . This is designed to reassure investors that management will not overpay for 'trophy' assets or dilutive growth.
Slide 15: 2018 Outlook
This slide provides the hard numbers for the upcoming fiscal year. It forecasts ~3% total organic growth for Watts, with a 'Positive' margin rate across all regions. It also includes 'Other Key Inputs' such as Corporate Costs (~$37M), Interest Expense (~$17M), and an Effective Tax Rate of ~28%. The most impressive metric here is the Free Cash Flow Conversion >100% , which indicates a very high quality of earnings.
Slides 17 & 19: Appendix and Debt Reconciliation
The deck concludes with an Appendix section. Slide 19 provides a Reconciliation of Long-term Debt to Net Debt to Capitalization Ratio . It shows a steady improvement in the balance sheet, with the ratio dropping from 28.4% in 2015 to 20.7% in 2017. This demonstrates financial health and the capacity to take on more debt for the right acquisition if needed.
What Watts Water Technologies Does Well
The deck excels at segmentation and transparency . By breaking down revenue by geography, end market, and sector, Watts makes it very easy for an analyst to model their business. They don't hide behind vague 'growth' terms; they provide specific percentages for their revenue splits. Furthermore, the Margin Improvement Roadmap (Slide 11) is a masterclass in setting expectations. It clearly distinguishes between what has already been achieved ('Self Help' initiatives) and what is yet to come (Growth and Operational initiatives).
The M&A Framework (Slide 13) is also a standout. Many companies are vague about their acquisition strategy, leading to investor anxiety about 'diworsification.' Watts sets hard financial hurdles that signal a conservative, shareholder-friendly approach to capital allocation.
What is Missing from the Deck
While this is a strong public market deck, it lacks a few elements that would be found in a modern private equity or venture-backed presentation. First, there is no competitive landscape analysis . While they claim their product range is 'unmatched,' they do not name or compare themselves to competitors like Zurn or Reliance Worldwide. Second, the 'Team' slide is missing from this 10-slide selection. In a transformation story, the background of the executives leading the 'LEAN' initiatives is usually a major selling point. Finally, there is very little technological 'vision.' While they mention 'New Product Development,' there is no mention of IoT, smart water management, or digital transformation, which were becoming major themes in 2018.
What Other Founders Can Copy
Founders of mature or 'boring' businesses can learn a lot from the 'Regulatory Moat' argument on Slide 3. If your business is driven by compliance or codes, highlight it. It is the ultimate form of recurring revenue because the customer has no choice but to buy. Additionally, the cutaway diagram on Slide 7 is a highly effective way to visualize a complex product catalog. Instead of a boring list of SKUs, showing the products in their natural environment makes the scale of the company tangible. Finally, the use of 'Self-Help' terminology is a great way to frame internal improvements. It tells investors that the company isn't just waiting for the market to improve; they are taking active steps to increase value through their own operational excellence.
Conclusion
The Watts Water Technologies deck is a study in industrial discipline. It is not a deck designed to excite; it is a deck designed to reassure. By focusing on margin expansion, regulatory tailwinds, and conservative capital allocation, Watts makes a compelling case for being a 'safe' and 'improving' bet for institutional capital. For any company operating in a fragmented, legacy industry, this deck provides a blueprint for how to present a consolidation and optimization story to the market.
Frequently asked questions
- What is the primary value proposition of Watts Water Technologies in this deck?
- The value proposition is built on being a global leader in water products with a 'balanced' portfolio. Watts emphasizes that 65% of its sales are driven by plumbing codes and regulations, which creates a recurring, non-discretionary revenue stream. They position themselves as a 'strong cash generator' that has finished a painful internal restructuring and is now ready to deploy capital for growth.
- How does Watts segment its market and revenue sources?
- Watts uses three primary lenses for segmentation on Slide 3: Geography (65% Americas, 30% Europe, 5% APMEA), End Markets (65% Repair/Retrofit vs. 35% New Construction), and Sector (60% Non-Residential vs. 40% Residential). This triple-axis reporting is designed to show investors that the company is not overly dependent on any single economic driver, such as new home starts.
- What are the specific 'self-help' initiatives mentioned in the deck?
- On Slide 11, the company details its 'Transformation' phase, which included portfolio rationalization, footprint optimization, global sourcing, and Europe restructuring. These initiatives helped move the adjusted operating margin from 10.1% in 2015 to 11.9% in 2017. The next phase of growth relies on 'Operational Initiatives' like LEAN manufacturing and functional excellence to reach their 14% goal.
- What does the M&A framework tell us about their risk appetite?
- Watts appears to have a low risk appetite for speculative acquisitions. Slide 13 outlines strict financial hurdles: the Return on Invested Capital (ROIC) must exceed the cost of capital, the deal must be accretive to Earnings Per Share (EPS) in the first year, and it must improve operating margins by the third year. This suggests they prioritize immediate financial health over long-term 'moonshot' technologies.
- What are the key financial projections for the 2018 fiscal year?
- Slide 15 projects total organic revenue growth of approximately 3% for the company. Regionally, they expected the Americas to grow 3-5%, Europe 1-3%, and APMEA 7-10%. They also forecasted a free cash flow conversion rate of over 100% and an effective tax rate of approximately 28%, with a total share count of 34.4 million shares.