Belden’s 2016 investor presentation serves as a strategic roadmap for a legacy industrial company attempting to shed its 'commodity' label. The deck centers on a narrative of transformation, moving from low-margin wire products to high-value signal transmission and cybersecurity solutions. With a heavy emphasis on financial discipline, the slides showcase a 21.4% CAGR in free cash flow per share from 2005 to 2015 and a significant gross profit margin expansion of 1,930 basis points. By segmenting its business into high-growth areas like Network Security (26.7% EBITDA margin) and Industrial IT…
Key takeaways
- Belden explicitly addresses and refutes the 'misperception' that it is merely a wire and cable company on slide 7.
- The company demonstrates a significant margin expansion, showing a gross profit margin improvement of 1,930 basis points between 2005 and 2015 (Slide 7).
- Free cash flow per share grew at a 21.4% CAGR over a ten-year period, reaching $4.94 in 2015 (Slide 10).
- The business model relies on a mix of organic market growth (1-3%), share capture (2%), and inorganic activity (2%) to reach a 5-7% total growth goal (Slide 16).
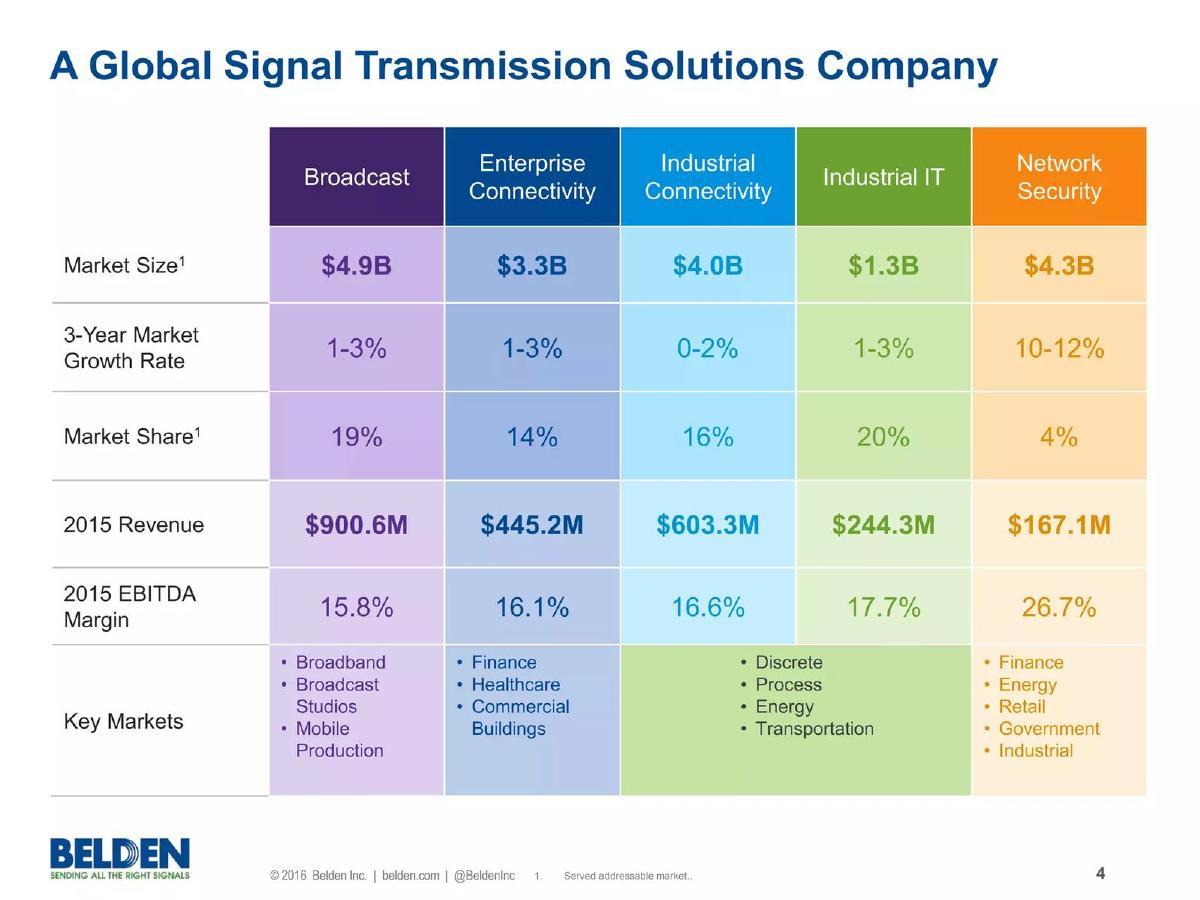
- Network Security is identified as the highest-margin segment with a 26.7% EBITDA margin in 2015 (Slide 4).
- The deck highlights a strategic shift in product mix from 2008 to 2015, specifically noting the divestment of cable and acquisition of software and networking assets (Slide 13).
- Belden sets clear three-year financial goals, including an EBITDA margin target of 18-20% and a Return on Invested Capital of 13-15% (Slide 16).
- The presentation includes granular 2016 assumptions, such as a projected copper price of $2.05 and a tax rate of 20% (Slide 19).
Belden 2016 Investor Deck: A Study in Strategic Evolution
The 2016 investor presentation for Belden Inc. is a comprehensive look at how a legacy industrial brand manages market perception during a period of radical transformation. The deck, spanning 30 slides (with 10 key slides analyzed here), moves away from the technical specifications of wires and cables to focus on high-level financial metrics, market segmentation, and strategic acquisitions. It is designed to convince institutional investors that Belden is no longer a cyclical commodity play, but a high-margin technology partner in the 'interconnected world.'
Slide 1: Title and Positioning
The cover slide establishes the theme: "Leading the Way to an Interconnected World." By using the term "interconnected," Belden immediately aligns itself with the then-surging trends of IoT (Internet of Things) and Industry 4.0. The date, February 2016, places this presentation at a time when industrial companies were under pressure to prove their digital relevance. The tagline "Sending All The Right Signals" serves as both a literal nod to their products and a metaphorical nod to their corporate governance and financial health.
Slide 4: A Global Signal Transmission Solutions Company
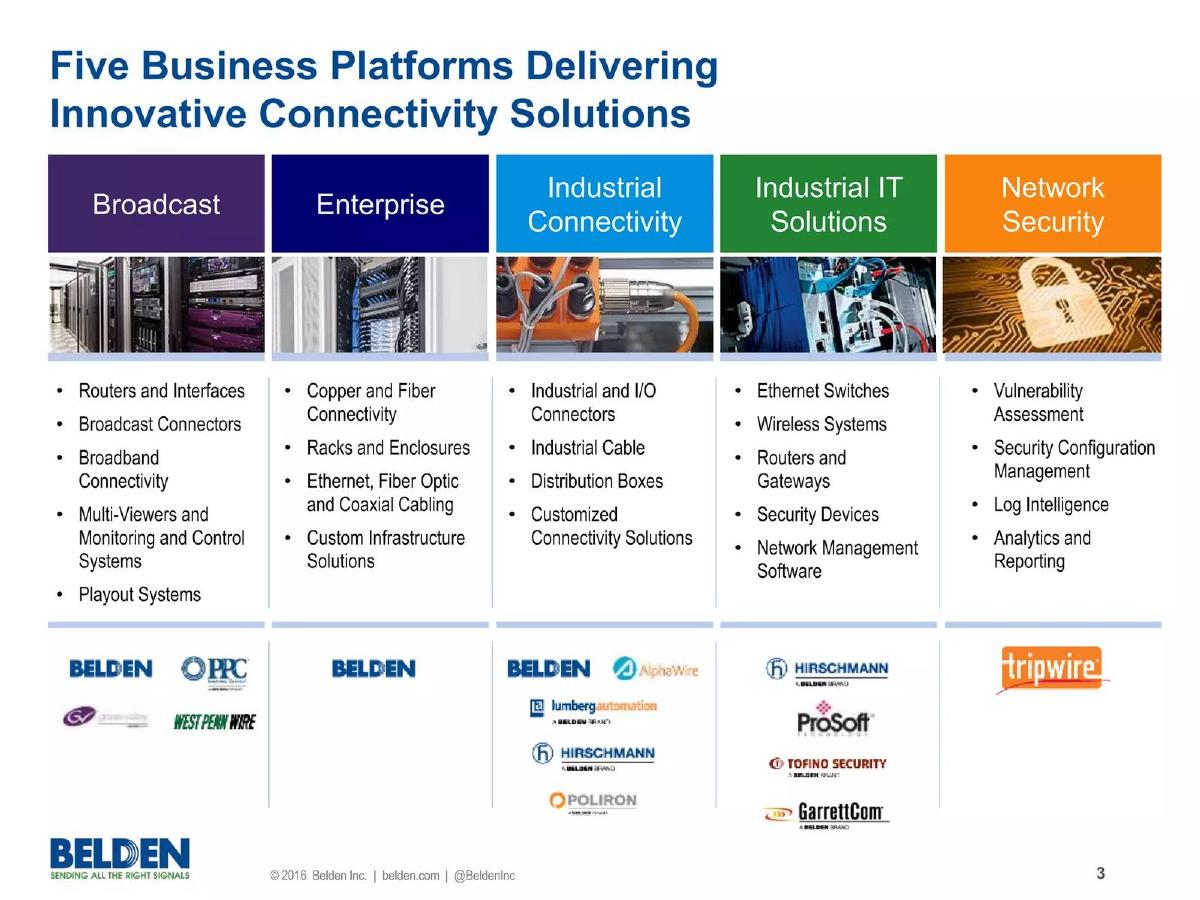
This slide is the core of Belden's value proposition. It breaks the company into five distinct segments: Broadcast, Enterprise Connectivity, Industrial Connectivity, Industrial IT, and Network Security. Key figures from Slide 4:
Broadcast: The largest revenue generator at $900.6M with a 19% market share. · Network Security: The highest growth potential (10-12% market growth rate) and highest margin (26.7% EBITDA margin). · Industrial IT: Boasts a 20% market share in a $1.3B market.
By presenting this matrix, Belden shows investors that while their legacy business (Broadcast) provides scale, their newer segments (Network Security and Industrial IT) provide the margin expansion and growth required for a premium valuation.
Slide 7: Addressing the Wire and Cable Misperception
Slide 7 is a defensive yet data-driven response to market skepticism. It explicitly quotes the "Common Misperception" that "Belden is a Wire and Cable company." The accompanying bar chart shows Gross Profit Margin from 2005 to 2015. The visual evidence is striking: Belden’s margins rose from approximately 22% in 2005 to over 40% in 2015. The slide highlights an "Improvement of 1,930 bps" (basis points). By shading the margin ranges of "Cable Peers" (green) and "Connectivity Peers" (purple), Belden visually proves it has graduated into a higher-tier peer group.
Slide 10: Free Cash Flow Generation
For a mature company, cash is king. Slide 10 focuses on "High Quality Earnings," defined here as Free Cash Flow (FCF) per share. The chart shows a 21.4% CAGR from 2005 ($0.71) to 2015 ($4.94). This slide is intended to build trust with value investors, showing that the company's strategic shift isn't just a theoretical exercise in branding—it is resulting in tangible, spendable cash. The steady climb, despite a dip in 2010, suggests a resilient business model capable of weathering economic cycles.
Slide 13: The Portfolio Transformation (2008 vs. 2015)
This slide uses stacked bar charts to show how the business has changed. The "Market" and "Product" mixes in 2008 were dominated by Enterprise and Cable. By 2015, the "Product" mix shows a significantly smaller "Cable" segment and a much larger "Networking" and "Connectivity" presence, plus the addition of "Security." The text in the center—"Divested cable" and "Acquired software, networking and connectivity"—tells the story of an active management team that is not afraid to prune low-performing assets to fund high-performing ones.
Slide 16: Business Model Goals
Belden sets clear expectations for the future on Slide 16. The "Three Year Financial Goals" include:
Growth: 5 - 7% · EBITDA: 18 - 20% · ROIC: 13 - 15% · Free Cash Flow: Exceed Net Income
The slide also provides a formula for their growth: 1-3% Market Growth + 2% Share Capture + 2% Inorganic Activity = 5-7% Total Growth. This level of transparency allows analysts to hold management accountable to specific levers of growth. The inclusion of "Tailwinds" (Cybersecurity, Broadband) and "Headwinds" (Strong US dollar, low oil prices) adds a layer of realism to the projections.
Slide 19: 2016 Assumptions
This is a highly technical slide that provides the underlying data for their 2016 guidance. It includes specific commodity prices (Copper at $2.05), currency exchange rates (Euro at $1.05), and interest expenses (~$95 million). Most notably, it claims a "$0.29 of favorable impact to EPS from productivity improvement programs." This indicates that Belden is looking inward at operational efficiency, not just outward at market trends, to drive earnings.
Slide 22 & 25: Q4 2015 Earnings and Segment Overview
Slide 22 acts as a transition to the quarterly results. Slide 25 provides a granular breakdown of the five segments for Q4 2015. Notable Q4 figures:
Broadcast: $239.5M Revenue, 19.5% EBITDA Margin. · Network Security: $48.9M Revenue, 30.0% EBITDA Margin.
The right side of Slide 25 includes icons of actual products (Camera Mounted Fiber Solutions, Racks, Industrial Switches, etc.), which helps ground the abstract financial data in physical reality. It shows the breadth of their catalog, from hardware to "Targeted Attack Detection" software.
Slide 28: Balance Sheet Highlights
The final data slide focuses on liquidity and leverage. It compares Q4 2015 to Q3 2015 and Q4 2014. While cash and equivalents dropped significantly from Q4 2014 ($741M) to Q4 2015 ($217M), likely due to acquisitions or debt repayment, the company highlights an improvement in "Net Leverage" from 4.0x in Q3 to 3.6x in Q4. This deleveraging narrative is crucial for maintaining a strong credit rating and investor confidence during a transformation.
What Belden Does Well
Belden excels at narrative-driven data. They don't just show a margin chart; they show a margin chart that explicitly refutes a specific market misperception. By categorizing their business into segments with varying growth and margin profiles, they allow investors to value the company as a sum-of-the-parts, which often leads to a higher total valuation than a single-entity view. The focus on Free Cash Flow per share (Slide 10) is a sophisticated way to demonstrate value creation that goes beyond simple GAAP earnings, which can be distorted by the very acquisitions and divestitures Belden is pursuing.
What is Missing from the Deck
While the deck is strong on financials, it is light on the competitive landscape. There is no slide dedicated to identifying specific competitors in the Network Security or Industrial IT spaces. Investors are left to wonder who Belden is winning share from. Additionally, while the deck mentions "Inorganic Activity" as a growth pillar, it does not provide a pipeline or a specific strategy for how they identify and integrate acquisition targets. Finally, there is no "Team" slide in this selection, which is common for established public companies but leaves a gap regarding who is actually steering this complex transformation.
What Other Founders and Executives Should Copy
The "Business Model Goals" slide (Slide 16) is a template every executive should follow. Breaking down a 7% growth target into its component parts (market growth, share capture, M&A) makes the goal feel achievable and measurable. Furthermore, the use of a "Common Misperception" slide (Slide 7) is a powerful rhetorical tool. If your company is being pigeonholed into a low-value category, you must address it head-on with data that proves you belong elsewhere. Finally, the granular "Assumptions" slide (Slide 19) builds immense credibility; it shows that management has a firm grip on the external variables that affect their bottom line.
Frequently asked questions
- How does Belden differentiate itself from traditional cable companies?
- Belden uses slide 7 to visually demonstrate that its gross profit margins have moved out of the 'Cable Peers' range (approx. 15-23%) and into or above the 'Connectivity Peers' range (approx. 28-38%). They attribute this to a strategic shift away from commodity cabling toward integrated signal transmission solutions, software, and network security, which command higher premiums and stickier customer relationships.
- What are the primary growth drivers identified in the deck?
- According to slide 16, Belden targets a total growth of 5-7%. This is broken down into three components: 1-3% from underlying market growth, 2% from capturing additional market share, and 2% from 'inorganic activity' (M&A). They specifically cite cybersecurity, broadband demand, and enterprise strength as tailwinds supporting these targets, while acknowledging headwinds like a strong US dollar and low oil prices.
- Which business segment is the most profitable for Belden?
- The Network Security segment is the most profitable in terms of margin. Slide 4 shows it had a 26.7% EBITDA margin in 2015, significantly higher than Broadcast (15.8%) or Enterprise Connectivity (16.1%). Slide 25 further confirms this trend for Q4 2015, where Network Security achieved a 30.0% EBITDA margin, despite having the lowest revenue among the five reported segments.
- What is Belden's strategy regarding capital allocation and cash flow?
- Belden emphasizes 'High Quality Earnings' through free cash flow (FCF) generation. Slide 10 shows a consistent upward trajectory in FCF per share. Their stated goal on slide 16 is for free cash flow to 'Exceed Net Income.' This suggests a focus on operational efficiency and disciplined working capital management to fund their inorganic growth strategy and return value to shareholders.
- How has Belden's product portfolio evolved over time?
- Slide 13 provides a side-by-side comparison of the company in 2008 versus 2015. In 2008, the 'Cable' product category represented a massive portion of their output. By 2015, the 'Cable' footprint had shrunk significantly, replaced by expanded 'Networking' and 'Connectivity' categories, along with the introduction of a 'Security' category. This visualizes their transition from a hardware manufacturer to a solutions provider.