The Calix investor presentation from February 2016 serves as a technical and financial roadmap for a company positioned at the center of the global fiber rollout. By showcasing a product suite that spans from the data center to the subscriber edge (Slide 6), Calix argues for the superiority of fiber over traditional DSL and cable in terms of ARPU and operational efficiency (Slide 16). The deck is heavy on financial validation, showing a consistent revenue climb to $407.5 million in 2015 and a significant gross margin expansion to 49.0% (Slide 26). While the presentation is dense with technica…
Key takeaways
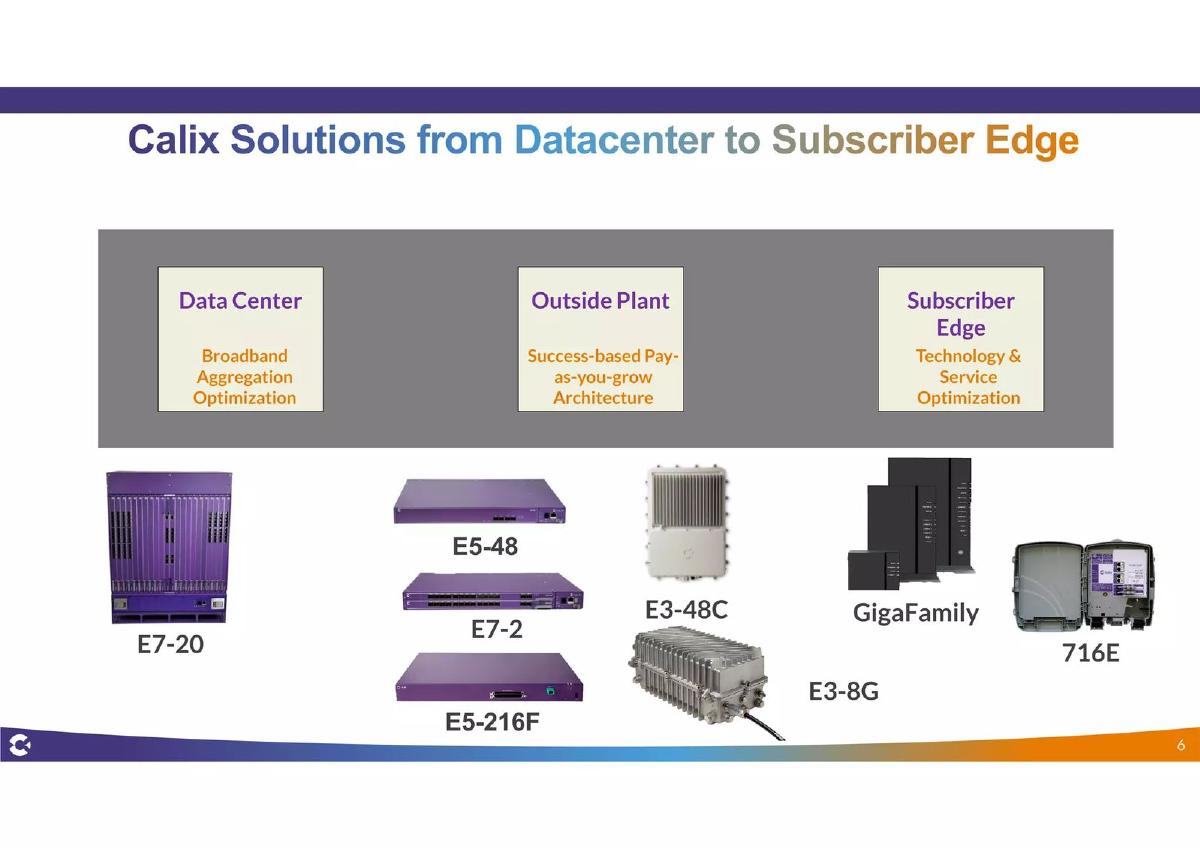
- Calix offers a hardware and software stack covering the Data Center, Outside Plant, and Subscriber Edge (Slide 6).
- Fiber-to-the-Home (FTTH) generates significantly higher ARPU ($134) compared to DSL ($102) and Cable ($120) (Slide 16).
- Operating expenses for fiber networks are lower, with 43% of respondents seeing >20% savings (Slide 16).
- Conventional cable networks are limited by HFC and DOCSIS constraints, typically capping at 100 Mbps (Slide 21).
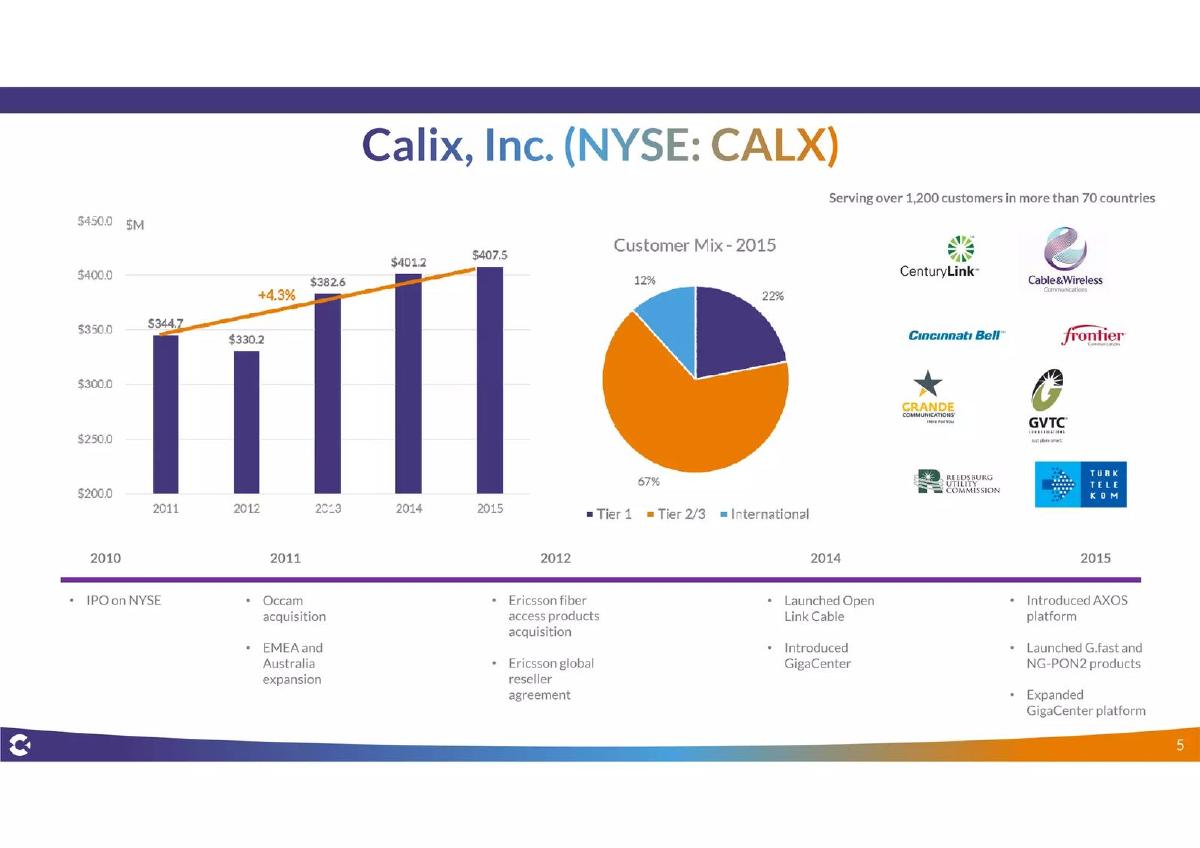
- Revenue grew at a 4.2% CAGR from 2011 to 2015, reaching $407.5 million (Slide 26).
- Gross margins improved by 530 basis points between 2011 and 2015, ending at 49.0% (Slide 26).
- Software-Defined Networking (SDN) is positioned as a requirement for cost savings and rapid service response (Slide 36).
- Market momentum is demonstrated by a massive cluster of new fiber deployments by major carriers like AT&T and Comcast in 2014-2015 (Slide 41).
Executive Summary and Brand Identity
Slide 1: Title Slide
The presentation opens with a minimalist title slide featuring the Calix logo and the text 'Calix Investor Presentation' dated February 2016. The branding uses a dark background with a purple and orange accent bar at the bottom, a visual theme that persists throughout the deck. This slide establishes the company as a professional, established entity in the telecommunications infrastructure space.
Product and Solution Architecture
Slide 6: Calix Solutions from Datacenter to Subscriber Edge
This slide provides a comprehensive overview of the Calix product portfolio. It categorizes their offerings into three distinct segments of the network: Data Center , Outside Plant , and Subscriber Edge . Under Data Center, the focus is on 'Broadband Aggregation Optimization' featuring the E7-20 chassis. The Outside Plant section highlights a 'Success-based Pay-as-you-grow Architecture' with the E5-48, E7-2, E5-216F, and E3 series (E3-48C and E3-8G). Finally, the Subscriber Edge focuses on 'Technology & Service Optimization' through the GigaFamily and 716E devices. This slide is critical because it demonstrates that Calix is not a point-solution provider but an end-to-end infrastructure partner for service providers.
Market Opportunity and Fiber Benefits
Slide 11: The Access Market Opportunity
This is a simple transition slide titled 'The Access Market Opportunity.' It signals a shift from internal product capabilities to the broader external market dynamics that drive demand for Calix solutions.
Slide 16: Compelling Benefits From Fiber Networks
This slide is data-dense and serves as the core economic argument for fiber adoption. It presents four key metrics:
FTTH Results in Higher ARPU: Fiber-to-the-Home (FTTH) shows an ARPU of $134, compared to $120 for Cable, $102 for DSL, and $102 for Wireless. · Fewer Reported Reboots: FTTH requires only 1.1 reboots per month, significantly lower than Cable Modem (1.5 to 2.1) and DSL (2.4 to 2.6). · Lower Operating Costs: A pie chart indicates that 43% of respondents estimate operating expense savings of greater than 20% when moving to fiber. · High Customer Take Rates: A bar chart correlates median household income with take rates, showing high adoption in areas like Wornall Homestead (83%) and Countryside (67%).
The slide cites sources including RVA LLC, Google Fiber, and Bernstein Proprietary Census, lending third-party credibility to the claims.
Competitive Landscape and Technical Constraints
Slide 21: Cable Networks: The Conventional Way
Calix uses this slide to illustrate the limitations of the incumbent technology. It diagrams a 'Conventional' cable network using Back Office, CMTS, HFC (Hybrid Fiber-Coaxial), and Cable Modems. It explicitly labels the 'Typical limit' of this architecture as 100 Mbps under the DOCSIS standard. By highlighting these bottlenecks, Calix positions its own fiber-based 'Unified Access' as the only viable path for providers needing to offer gigabit speeds and beyond.
Financial Performance and Growth Metrics
Slide 26: Full-year 2015 Income Statement Highlights
This slide provides the financial validation for the company's strategy. It highlights two primary areas of success:
Revenue Growth: Full-year 2015 revenues reached $407.5 million, a 2% year-over-year increase. The chart shows a steady climb from $344.7 million in 2011, representing a 4.2% CAGR. · Gross Margin Expansion: Gross margins reached 49.0% in 2015, an increase of 230 basis points year-over-year and 530 basis points since 2011.
The text attributes this performance to 'strength across multiple customers,' a 'favorable product mix,' and 'improved operating efficiency.' This slide is essential for investors as it proves the company can scale its top line while simultaneously improving its profitability profile.
Technical Evolution and Future-Proofing
Slide 31: Appendix
A transition slide marking the beginning of the supplemental technical and market data section.
Slide 36: What does SDN/NFV require?
This slide addresses the industry shift toward Software-Defined Networking (SDN) and Network Functions Virtualization (NFV). It features a quote from a July 2015 report by Hewlett-Packard, Light Reading, and Heavy Reading. The key takeaway is that vendors must design platforms that 'no longer rely on the hardware providing the reliability but instead are designed to assume the probability of hardware failures and perform failover in software instead.' This positions Calix’s move toward a software-centric network as a necessary evolution to meet CSP demands for rapid response and cost savings.
Slide 41: Deployments Accelerating
The final slide in the provided set is a timeline of fiber deployments from 2010 to 2015. It shows a sparse landscape in 2010-2012 (dominated by Google Fiber and Time Warner) followed by a massive explosion of activity in 2014 and 2015. Names like AT&T, Comcast, Cox, CenturyLink, and Frontier appear multiple times in the 2015 column. This visual effectively communicates that the market is at an inflection point, creating a sense of urgency for investors to back the infrastructure providers fueling this growth.
What Works in the Calix Deck
The Calix deck is a masterclass in using data to support a technical narrative. The inclusion of Slide 16 is particularly effective because it translates technical specs (fiber vs. copper) into business outcomes (ARPU and OpEx). By showing that fiber users pay more and cost less to support, Calix makes the purchase of their hardware an easy decision for a service provider's CFO.
Furthermore, the financial slide (Slide 26) is exceptionally clear. It doesn't just show revenue; it shows margin expansion. In the infrastructure world, where hardware can often become commoditized, proving that margins are increasing suggests that Calix has significant intellectual property or 'stickiness' in its software and unified architecture that prevents a race to the bottom on price.
What is Missing from the Calix Deck
Despite the depth of technical and financial data, the provided slides omit several key components typical of a comprehensive investor presentation. There is no Team Slide in the provided selection, which is a significant omission for investors who want to know who is steering the ship during this technical transition. While the company is clearly established, the lack of leadership profiles leaves a gap in the 'human' element of the pitch.
Additionally, there is no explicit Competitor Comparison slide. While Slide 21 attacks the 'Conventional Way' (Cable/DOCSIS), it does not address other fiber equipment vendors like Nokia, Huawei, or Adtran. Investors would likely want to know how Calix differentiates itself specifically against other fiber-to-the-home equipment manufacturers, rather than just against older technology standards.
Finally, there is no Specific Ask or 'Use of Proceeds' slide in this set. As an 'Investor Presentation,' it functions more as a general corporate update than a targeted fundraising pitch. This is common for public or late-stage companies, but for a startup looking to raise, the absence of a clear funding goal and milestone roadmap would be a deal-breaker.
What Founders Should Copy
Founders in the hardware or infrastructure space should emulate Calix's 'Solution Map' (Slide 6) . It clearly communicates the breadth of their reach without getting bogged down in individual data sheets. It allows an investor to visualize exactly where the product sits in the customer's ecosystem.
The use of Third-Party Validation (Slide 41) is another excellent tactic. Instead of just saying 'the market is growing,' Calix plots every major industry player on a timeline. This creates a 'wall of logos' effect that is much more persuasive than a simple CAGR percentage. It proves that the biggest companies in the world are currently making the exact transition that Calix facilitates.
Lastly, the Economic Value Proposition (Slide 16) is a template for any B2B startup. By breaking down the value into ARPU (revenue up), Reboots (maintenance down), and OpEx (costs down), they cover every angle of the customer's P&L. Founders should always aim to present their product not just as a 'better tool,' but as a 'better business model' for their clients.
Frequently asked questions
- What is Calix's primary value proposition to service providers?
- Calix focuses on providing a Unified Access architecture that enables Communications Service Providers (CSPs) to transition to fiber networks. According to Slide 16, this transition allows for higher Average Revenue Per User (ARPU) and significant reductions in operating expenses. By moving to a software-centric network (SDN/NFV), providers can respond more rapidly to customer demands and reduce reliance on specific hardware reliability (Slide 36).
- How has Calix performed financially leading up to this presentation?
- The company demonstrated steady growth between 2011 and 2015. Revenue increased from $344.7 million to $407.5 million, representing a 4.2% CAGR (Slide 26). More importantly, the company showed strong operating leverage, with gross margins expanding from 43.7% to 49.0% over the same period. This margin growth is attributed to a favorable product mix and the efficiencies of their Unified Access architecture.
- What are the technical limitations of existing cable networks mentioned in the deck?
- Slide 21 illustrates the 'Conventional Way' of cable networking, which relies on Hybrid Fiber-Coaxial (HFC) and Data Over Cable Service Interface Specification (DOCSIS). The deck notes a typical limit of 100 Mbps for these systems. Calix positions its fiber solutions as the necessary upgrade to overcome these bandwidth bottlenecks and the high maintenance costs associated with older cable and DSL technologies.
- What market trends is Calix capitalizing on?
- Calix is riding the wave of accelerating fiber deployments. Slide 41 shows a timeline of carrier rollouts, noting a significant surge in activity from 2013 through 2015. Major players like Google Fiber, AT&T, CenturyLink, and Comcast are shown rapidly expanding their fiber footprints. This macro trend validates the demand for Calix’s infrastructure products across the entire network path.
- What is the role of software in Calix's strategy?
- Software is central to Calix's future-proofing strategy. Slide 36 emphasizes that capturing the potential of SDN (Software-Defined Networking) and NFV (Network Functions Virtualization) requires a shift away from hardware-centric reliability. By performing failover in software and virtualizing functions, CSPs can achieve greater agility and lower costs, which Calix supports through its evolving network platforms.