The PREIT (Pennsylvania Real Estate Investment Trust) May 2017 investor update is a strategic document detailing the company's 'transformation' from a broad mall operator to a focused owner of high-productivity assets. The deck highlights a significant reduction in property count—from 46 in 2012 to a projected 24 beyond 2018—while simultaneously increasing portfolio sales per square foot from $365 to a projected $538. By leaning into non-apparel categories like dining, fitness, and entertainment, PREIT attempts to insulate itself from the 'retail apocalypse.' The deck is data-heavy, utilizing…
Key takeaways
- PREIT executed a massive portfolio rationalization, reducing property count by nearly 50% between 2012 and 2018 to focus on higher-quality assets (Slide 5).
- Portfolio productivity increased significantly, with sales per square foot rising from $365 in 2012 to $465 in 2017 (Slide 5).
- The company proactively addressed anchor tenant risk by identifying specific locations for JC Penney, Macy's, Bon-Ton, and Sears that were at risk or slated for recapture (Slide 17).
- Diversification is a core pillar, with the strategy shifting toward grocery, fitness, and entertainment tenants to replace traditional apparel retailers (Slide 13).
- Major redevelopment projects, such as the Fashion Outlets Philadelphia, targeted an 8-9% incremental return on investment (Slide 21).
- The deck provides a transparent capital expenditure schedule, projecting total redevelopment spending of $130-$150 million in 2017 alone (Slide 29).
- Management emphasizes 'Department Store Rationalization' as a net positive, viewing the replacement of underperforming anchors with higher-rent specialty tenants as a value driver (Slide 9).
- The 'Beyond 2018' forecast predicts that over 57% of Net Operating Income (NOI) will come from assets producing over $500 per square foot (Slide 5).
Executive Summary: The Rationalization Playbook
The PREIT May 2017 Investor Update is a fascinating look at a company attempting to navigate the structural shifts of the American retail landscape. At a time when 'malls are dying' was the prevailing narrative, PREIT presented a counter-thesis: malls aren't dying; they are simply being right-sized and redefined. The deck is a clinical, data-driven argument for quality over quantity, showing how the company shed nearly half its properties to double down on high-performing urban and suburban hubs.
Slide 1: Title and Visual Positioning
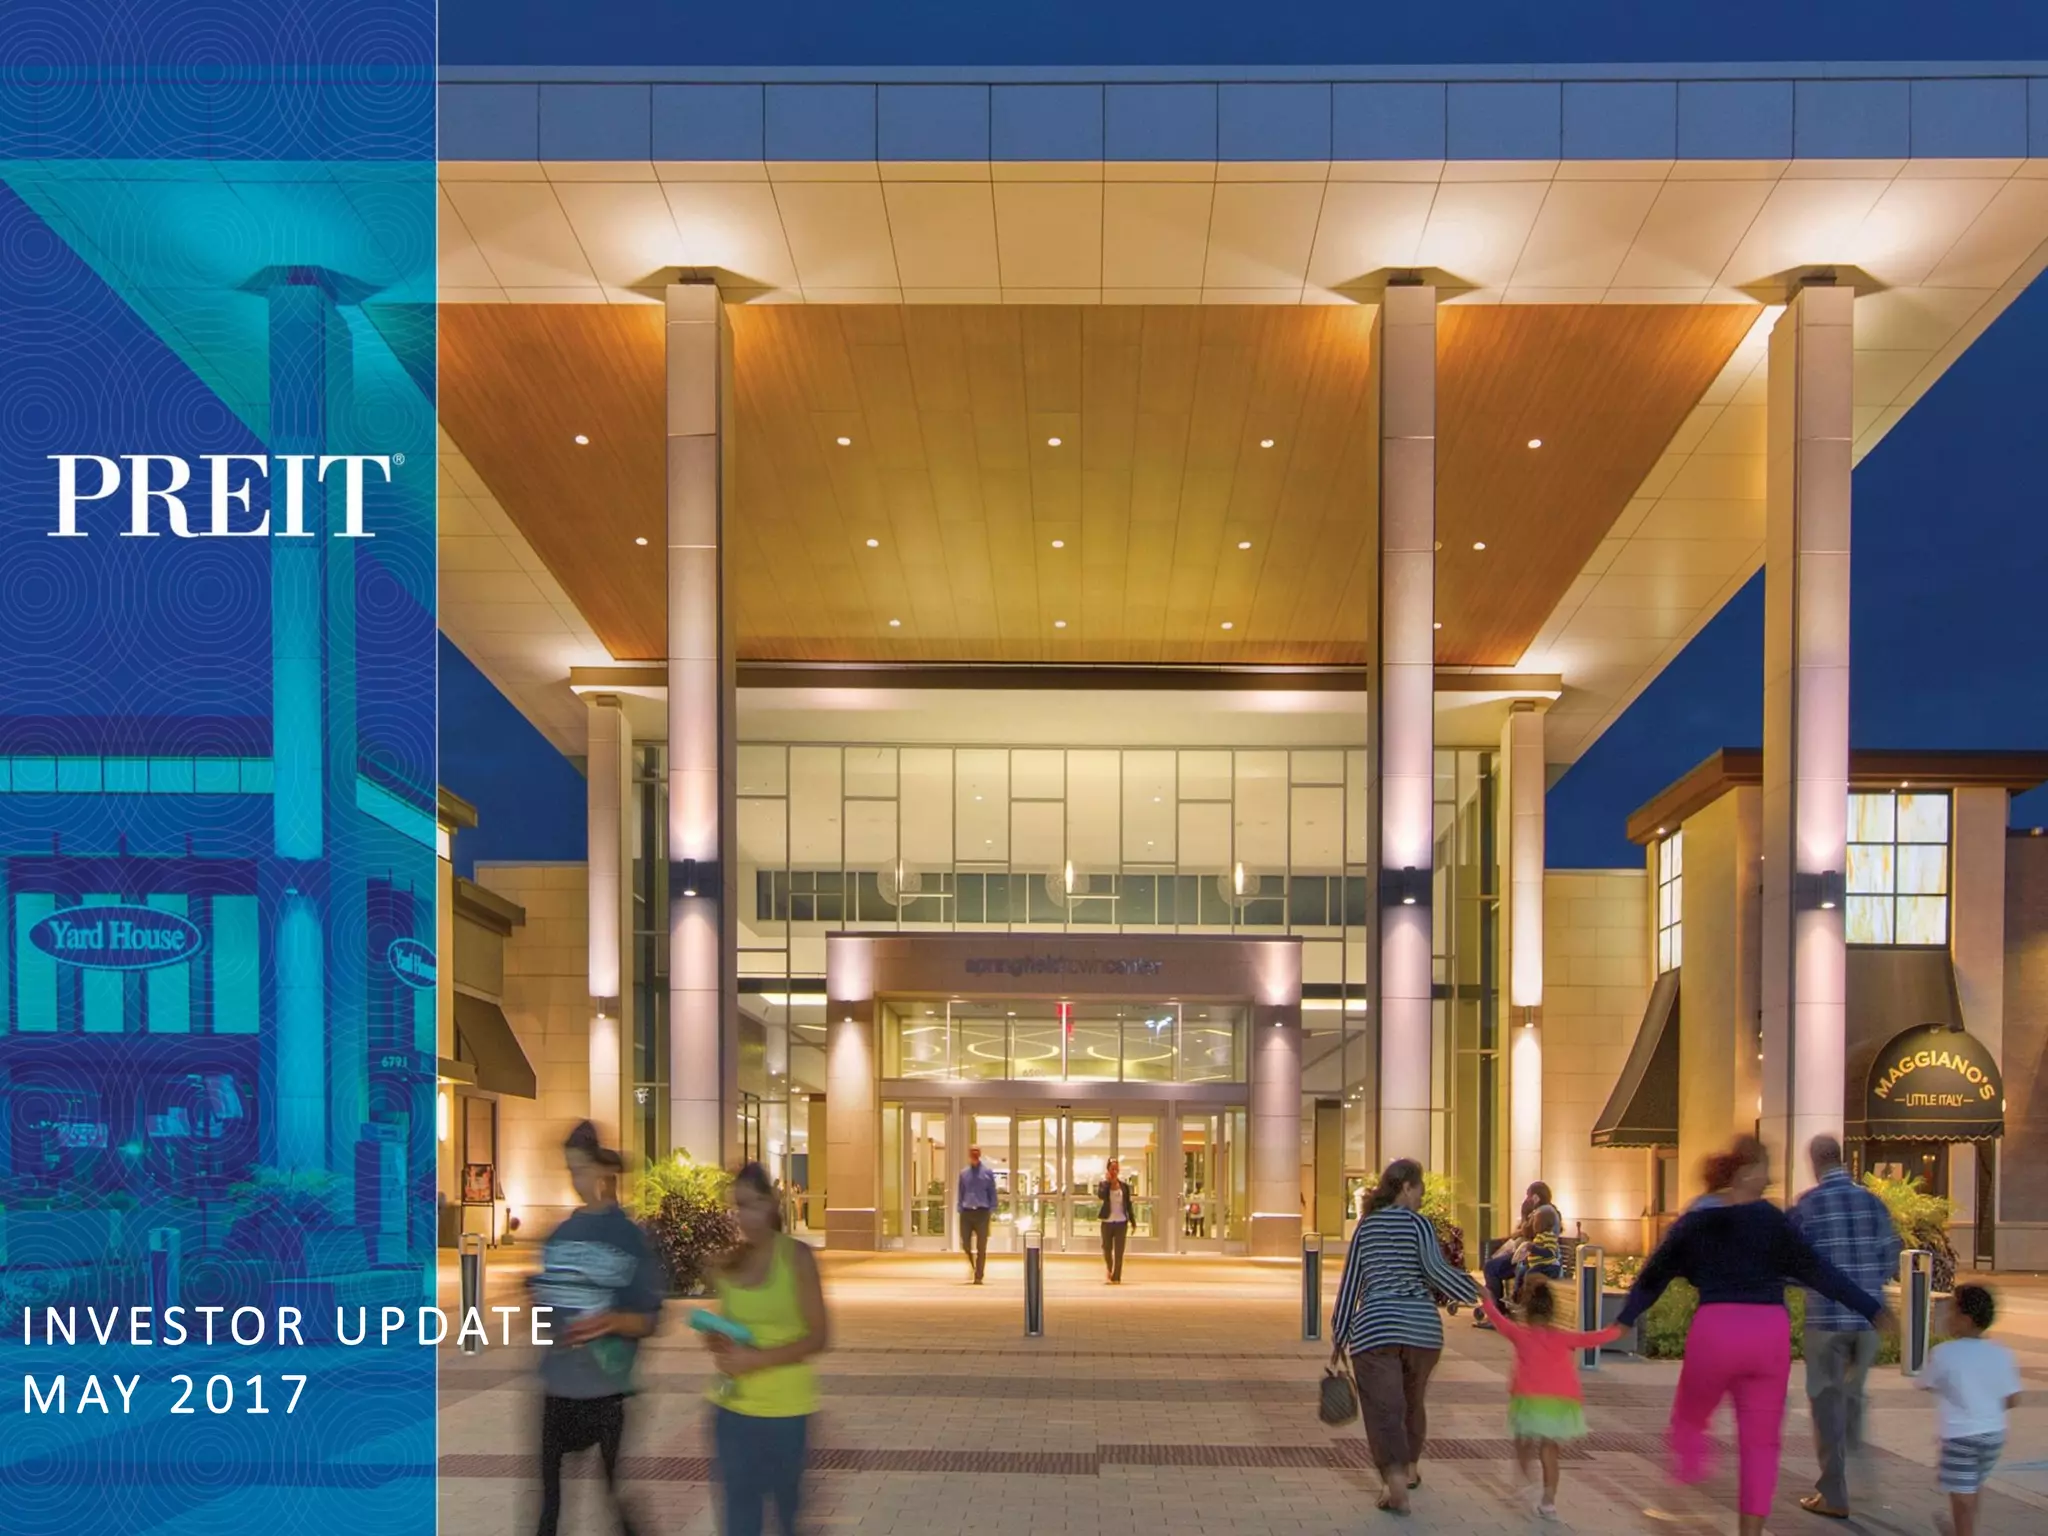
The cover slide features the Springfield Town Center, a flagship property that embodies the 'modern mall' aesthetic: high ceilings, natural light, and prominent dining signage (Yard House, Maggiano's). The branding is clean, and the title 'Investor Update May 2017' sets the stage for a performance review rather than a speculative pitch.
Slide 5: Transformation By The Numbers
This is arguably the most important slide in the deck. It quantifies the 'Transformation' through a side-by-side comparison of 2012, 2017, and 'Beyond 2018.' Key figures include:
Property Count: Dropped from 46 in 2012 to 26 in 2017, with a goal of 24. · Total GLA (Gross Leasable Area): Reduced from 33 million to 23 million square feet. · Portfolio Sales/SF: Increased from $365 to $465, with a target of $538. · High-Performance Assets: The number of assets producing >$500/SF grew from 3 to 5, with a target of more than 10.
This slide tells a clear story: PREIT is getting smaller to get better. By divesting 20 properties, they have significantly increased the average productivity of their remaining square footage.
Slide 9: Retail Industry Outlook
PREIT addresses the 'elephant in the room'—retailer bankruptcies and department store closures. They frame 'Department Store Rationalization' as 'Necessary' and a 'net positive.' They cite that 75% of spaces vacated in 2016-2017 were already covered by new tenants, resulting in 'Minimal Occupancy impact.' The slide concludes that the 'best locations win' by blending retail, dining, entertainment, and wellness under one roof.
Slide 13: Expanding Retailers - The New Mix
To prove their point about diversification, Slide 13 displays a 'logo cloud' of expanding tenants. Notably, these are not traditional clothing stores. They are categorized into:
Grocery: Lidl, Wegmans, Whole Foods, Sprouts. · Fitness: LifeTime Fitness, OrangeTheory, SoulCycle. · Big Box: Dick's Sporting Goods, The Container Store. · Entertainment: Dave & Buster's, AMC Theatres, Legoland. · Dining: Shake Shack, Chipotle, Yard House.
This slide serves as evidence that demand for physical space remains high, provided the tenant offers an 'experience' or a 'necessity' (like groceries) that cannot be easily replicated online.
Slide 17: Review of Additional Anchor Risk
Transparency is a hallmark of this deck. Slide 17 lists specific anchor tenants—JC Penney, Macy's, Bon-Ton, and Sears—and provides an 'Internal Risk Assessment' for each. For example, they identify '2 locations potentially at risk' for JC Penney and 'Sell 2, Proactively recapture 2' for Sears. By naming these risks, management builds credibility with investors, showing they are not reactive but proactive in managing their tenant base.
Slide 21 & 25: Strategy at Work (Case Studies)
These slides provide deep dives into specific projects. Fashion Outlets Philadelphia (Slide 21) is described as a 4-city-block transformation with an incremental cost of $153-$183 million and a projected 8-9% return. Mall at Prince Georges (Slide 25) focuses on 'Remerchandising,' noting that 73% of non-anchor space will be updated with tenants like H&M and ULTA. These slides move the deck from abstract strategy to concrete execution, showing exactly where the capital is being deployed.
Slide 29: Redevelopment Spend Timing
This slide provides a granular timeline for capital expenditures across the portfolio. It forecasts total spending of $130-$150 million in 2017, peaking at $160-$180 million in 2018, before tapering off significantly by 2020. This gives investors a clear view of the company's cash flow requirements and the 'light at the end of the tunnel' for their heavy investment phase.
Slide 33: Key Investment Highlights
The deck concludes with a summary of the value proposition. It emphasizes a 'Concentrated portfolio in densely populated, high barrier-to-entry markets' and 'Sufficient liquidity to manage existing projects.' It reiterates the 'Limited absolute exposure to Sears,' which was a major concern for REIT investors in 2017.
What PREIT Does Well
1. Fearless Rationalization: Most companies are afraid to tell investors they are shrinking. PREIT leans into it, proving that a smaller, more productive portfolio is more valuable than a bloated, mediocre one.
2. Specificity on Risk: By naming specific at-risk anchors and locations, they remove the 'unknown' factor that often leads to stock price volatility. They show they have a plan for every vacant box.
3. Metric Consistency: Throughout the deck, they stick to Sales PSF and Incremental Return. This consistency allows investors to track progress across different properties and time periods.
What is Missing
1. E-commerce Integration: While the deck mentions 'experience' retail, it lacks a detailed discussion of how these physical locations integrate with retailers' omni-channel strategies (e.g., buy-online-pickup-in-store metrics).
2. Debt Maturity Profile: For a REIT, the balance sheet is as important as the properties. While they mention 'sufficient liquidity,' a slide showing debt maturities would have provided more comfort regarding their ability to fund the $400M+ in projected redevelopment spend.
3. Competitive Benchmarking: The deck shows PREIT's improvement, but it doesn't show how they compare to peers like Simon Property Group or Macerich in the same markets.
Founder Takeaways
Own the Narrative of Change: If your industry is facing headwinds, don't ignore them. PREIT addressed the 'Retail Apocalypse' head-on by showing how they were evolving to meet it. Founders in disrupted industries should follow this lead: acknowledge the shift and show why your specific strategy thrives in the new environment.
Focus on 'Unit Productivity': Whether it's sales per square foot for a mall or revenue per head for a SaaS company, identifying the single most important metric of efficiency and showing a clear path to its improvement is the best way to win investor confidence.
Transparency Builds Trust: Listing your 'at-risk' customers or 'failed' experiments (like the 20 divested properties) isn't a sign of weakness; it's a sign of disciplined management. Investors would rather see a leader who knows what's broken and is fixing it than one who pretends everything is perfect.
Frequently asked questions
- What is the primary goal of PREIT's strategy according to this deck?
- The primary goal is 'Transformation through Rationalization.' PREIT is intentionally shrinking its footprint to improve the quality of its remaining assets. By selling off lower-performing malls in secondary markets, they aim to increase their average sales per square foot and ensure that a majority of their Net Operating Income comes from top-tier properties producing over $500 per square foot.
- How does PREIT view the wave of retail bankruptcies mentioned in the deck?
- Unlike many investors who fear retail bankruptcies, PREIT frames them as an opportunity for 'remerchandising.' Slide 9 notes that 75% of spaces vacated in 2016-2017 were already covered by new tenants. They argue that replacing old department stores with modern, high-traffic uses like grocery stores or entertainment centers actually improves the mall's overall health and returns.
- What specific metrics does PREIT use to measure success?
- The deck focuses on three main KPIs: Sales per Square Foot (PSF), the number of assets producing >$500 PSF, and the percentage of Net Operating Income (NOI) derived from those high-performing assets. They also track 'Incremental Return' on redevelopment projects, consistently targeting the 8-9% range for major renovations.
- Which tenant categories is PREIT prioritizing for its new 'merchandising mix'?
- PREIT is moving away from apparel-heavy mixes toward 'agnostic' retail formats. Slide 13 lists specific targets in Grocery (Wegmans, Aldi, Lidl), Fitness (LifeTime, SoulCycle), Entertainment (AMC, Dave & Buster's), and Dining (Shake Shack, Yard House). The goal is to create a 'blended' experience that includes health, wellness, and dining to drive consistent foot traffic.
- Is there information on the company's leadership or team in this deck?
- No. As this is an 'Investor Update' for a publicly traded REIT rather than a startup seed deck, the focus is entirely on portfolio performance, asset strategy, and financial projections. It assumes the audience is already familiar with the management team or can find that information in formal SEC filings.