The Olympic Shipping 27 presentation, dated May 2014, is a formal debt financing deck for a NOK 500 million bond issue. Unlike typical startup equity pitches, this document focuses on asset-backed security, long-term contract coverage, and balance sheet strength. The company showcases a sophisticated fleet of 21 offshore vessels, including PSVs, AHTS, and Subsea units, supported by a NOK 4.9 billion order backlog. The deck is characterized by high transparency regarding corporate structure, where founder Stig Remøy holds an 82.9% stake. It serves as a masterclass in presenting capital-intensi…
Key takeaways
- The primary objective of the deck is a NOK 500 million bond issuance to repay existing debt (OLSH01 PRO) and fund operations (Slide 6).
- The company operates a modern fleet of 21 offshore vessels, including 9 subsea vessels and 4 PSVs (Slide 11).
- Olympic Ship AS maintains a significant order backlog of NOK 4.9 billion including options as of May 2014 (Slide 16).
- The corporate structure is complex, involving multiple 'KS' (limited partnership) entities for specific vessels to manage risk and investment (Slide 6).
- Fleet utilization is highly visible, with a detailed chart showing contract coverage through 2019 for major charterers like Petrobras and Statoil (Slide 16).
- Financial health is anchored by a market-adjusted equity of NOK 4.7 billion and a market-adjusted equity ratio of 49% (Slide 21).
- The management team is led by founder Stig Remøy, a Master Mariner with 15 years of experience as a Master on fishing and offshore vessels (Slide 41).
- Market outlook data suggests a 25% projected growth in the total subsea fleet, with 115 vessels on order globally (Slide 31).
Introduction and Transaction Context
The Olympic Shipping 27 investor presentation, dated May 27, 2014, is a technical debt-financing document. Unlike a seed-stage startup deck designed to sell a vision, this deck is designed to sell stability, asset value, and cash flow predictability. The target is institutional bond investors capable of participating in a NOK 500 million issuance. The document is structured to provide deep transparency into the company's operational history, fleet composition, and financial obligations.
Slide 1: Title and Contemplated Issue
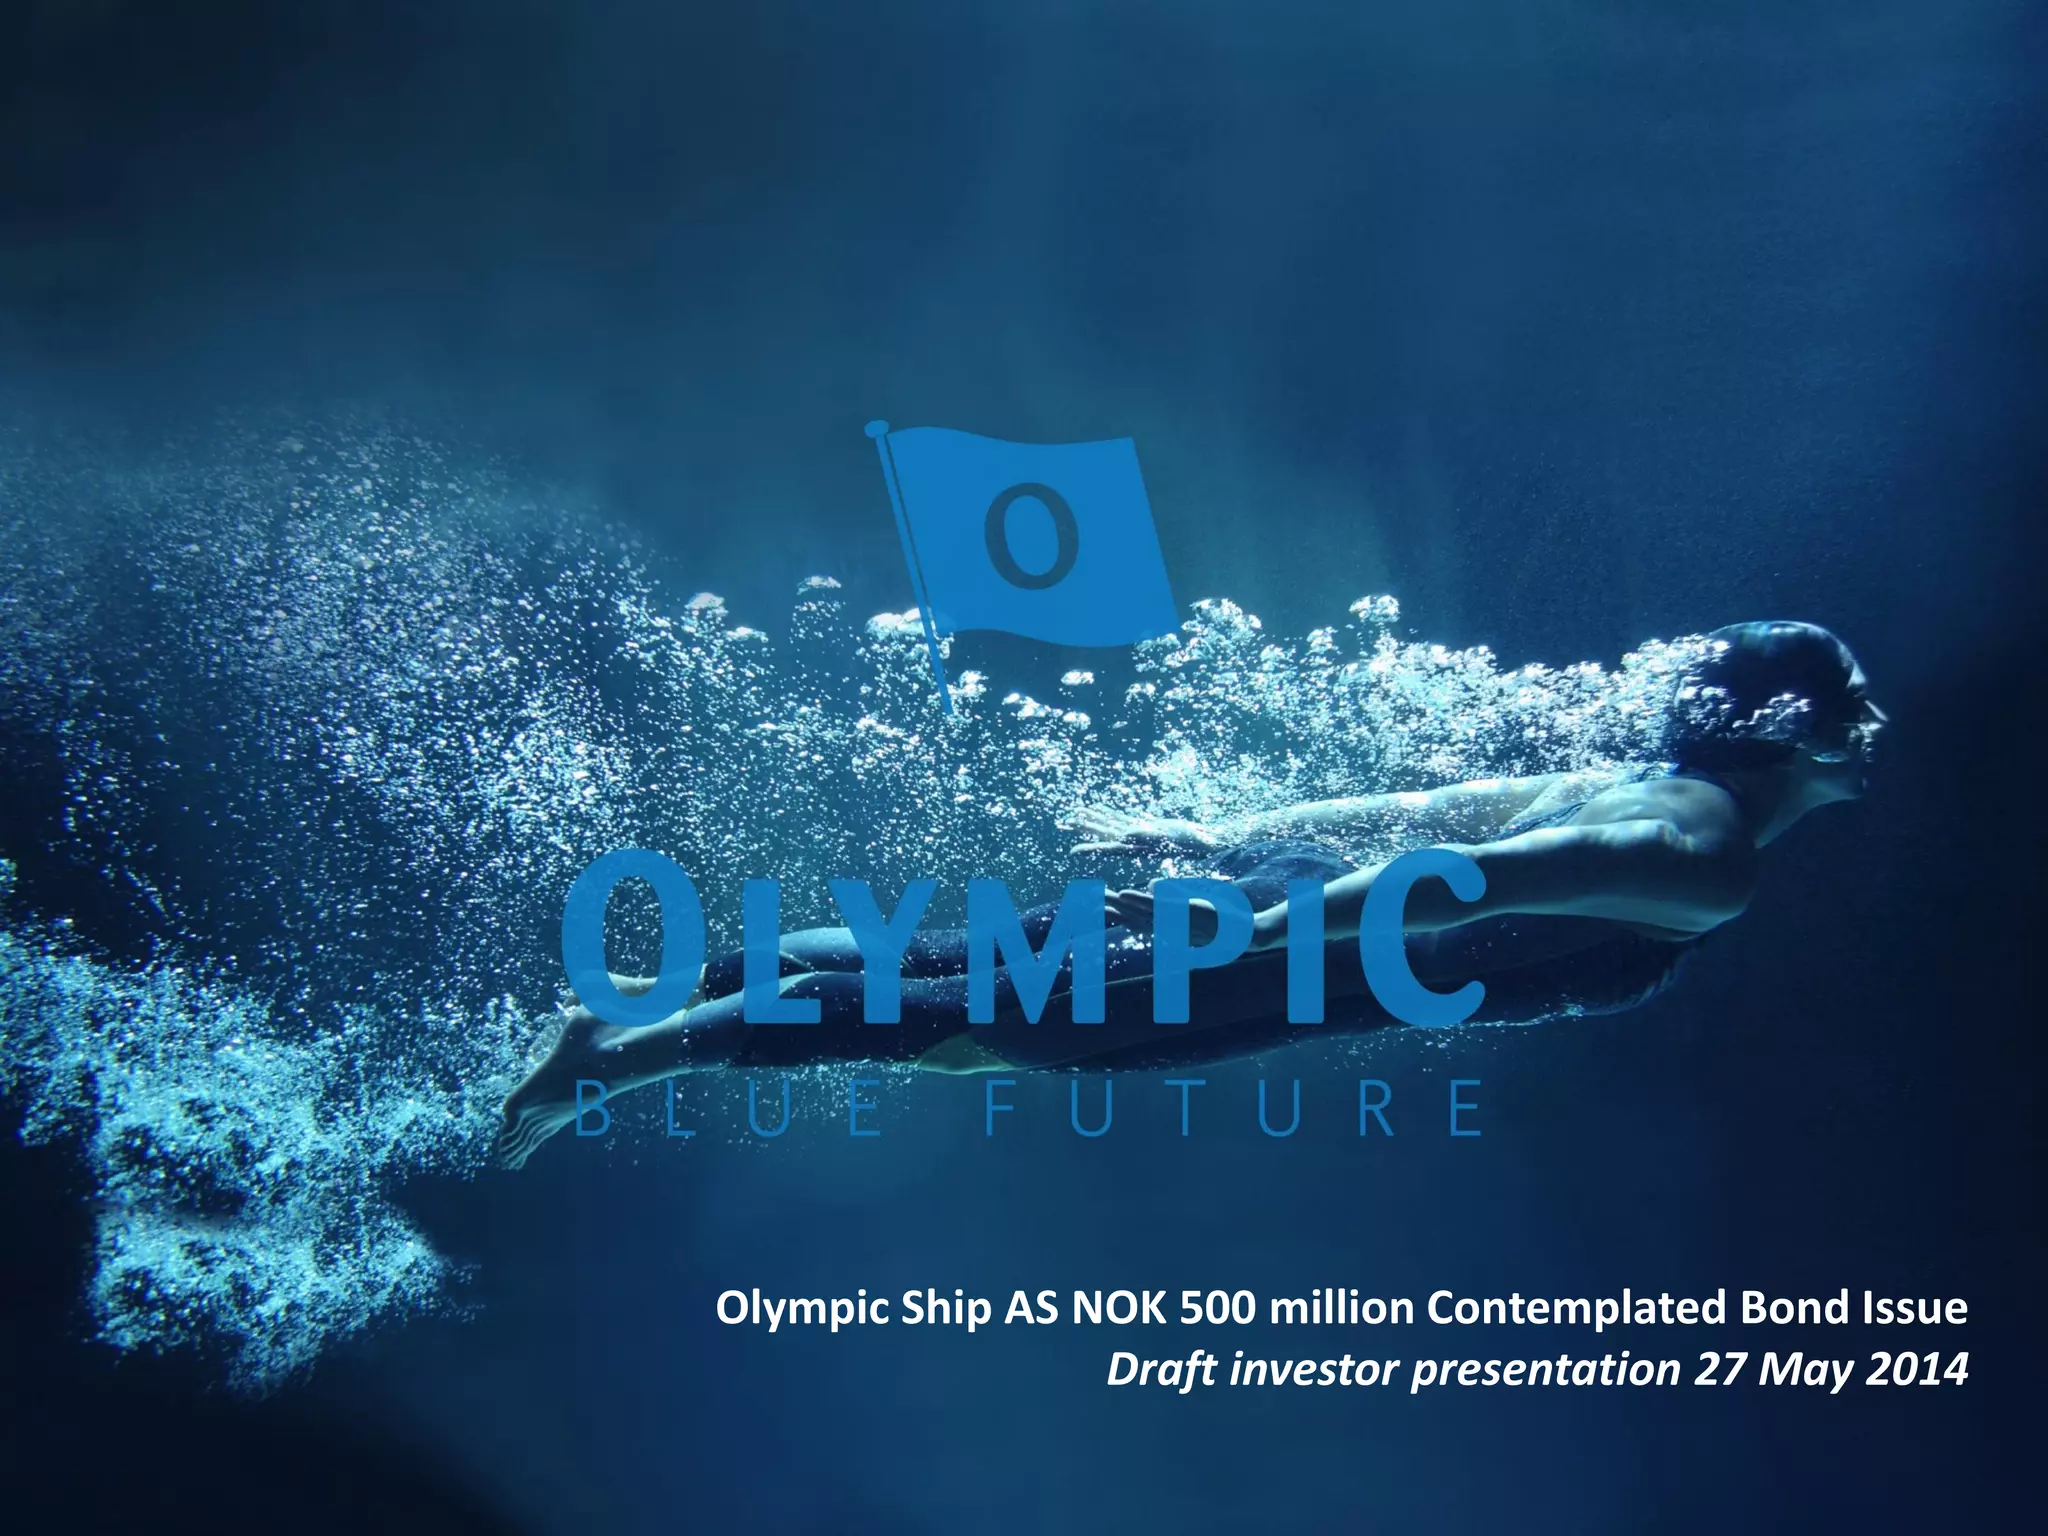
The cover slide establishes the professional tone of the raise. It clearly states the entity, Olympic Ship AS , and the target amount: NOK 500 million Contemplated Bond Issue . The branding uses the tagline "Blue Future," and the imagery of a swimmer underwater reinforces the maritime focus. The date, 27 May 2014, marks this as a specific point-in-time snapshot of the offshore industry before the significant oil price downturn later that year.
Slide 6: Transaction Summary and Group Overview
This is one of the most critical slides for understanding the company's mechanics. It details the corporate hierarchy and the specific purpose of the funds. Stig Remøy is identified as the majority owner with 82.9% of Olympic Holding AS. The slide clarifies that the proceeds from the NOK 500 million bond will be used to repay the OLSH01 PRO bonds (NOK 350 million outstanding). The organizational chart shows a complex web of subsidiaries, including Olympic Subsea KS (65%) , Olympic Master KS (51%) , and Olympic Nor AS (100%) . This structure is typical in shipping to isolate the liabilities of individual vessels while allowing for external 'KS' investors to participate in specific assets.
Slide 11: Olympic Group Business Areas
This slide breaks down the operational pillars of the group. It divides the business into three segments: Olympic Seafood (3 fishing vessels), Olympic Ship AS (the offshore fleet), and Olympic Shipping AS (technical and commercial management). The offshore fleet is the core of this deck, described as a "Modern high-end fleet of 21 offshore vessels." The breakdown includes 4 PSV vessels, 4 AHTS vessels, 4 MPSV, 9 Subsea vessels (including 2 newbuildings), and 2 offshore construction vessels. This diversity suggests the company is not reliant on a single type of offshore activity.
Slide 16: Contract Coverage as of May 2014
For a bond investor, this is the most important slide in the deck. It provides a visual timeline of contracted revenue for every ship in the fleet through 2019. The company reports an order backlog of NOK 4.9 billion including options (NOK 2.3 billion excluding options). The chart shows high utilization for vessels like the Olympic Hera and Olympic Poseidon , with major charterers such as Petrobras and Statoil . The presence of 'Spot' market vessels in the AHTS and OCV segments indicates where the company takes more market risk versus the long-term stability of the Subsea and PSV segments.
Slide 21: Balance Sheet
The financials slide provides a three-year lookback (2011A-2013A) plus Q1 2014 results. Key figures include Total Assets of NOK 8.146 billion and Total Equity of NOK 3.131 billion . A crucial note on the right side of the slide explains that the market value of the fleet (NOK 8.1 billion) is higher than the book value, leading to a market-adjusted equity ratio of 49% . This is a strong signal to lenders that the company is not over-leveraged relative to the actual liquidation value of its ships. The slide also tracks the increase in long-term debt, which is noted as typical for vessel deliveries, usually geared at 70-75%.
Slide 31: Market Outlook - Subsea Fleet Growth
To justify the expansion and the debt, the company provides macro-market data. It projects the total subsea fleet to grow by 25 per cent , with an order book of 115 vessels against a current fleet of 457. The chart breaks this down by vessel type, showing that Cable, Umbilicals & FP/Flowline Lay vessels have the highest growth projection at 47%. This data, sourced from Clarkson and SpareBank1 Markets, positions Olympic's fleet expansion as a response to clear market demand rather than speculative building.
Slide 41: Management Team
The management slide focuses on maritime and financial expertise. Stig Remøy (CEO) is highlighted as a Master Mariner with 15 years of experience as a Master, establishing his deep domain expertise. The team includes John Arne Winsnes (Deputy CEO) with a background in structured finance at GE Capital and ABB, and Per Kyrre Kvien (CFO) with banking experience at JPMorgan Chase. This combination of operational 'sea-time' and high-level financial experience is designed to reassure bondholders that the company can navigate both physical oceans and complex debt markets.
What Olympic Shipping 27 Does Well
The deck excels at asset-level transparency . In the shipping industry, the value is in the steel and the contracts attached to that steel. By providing a vessel-by-vessel breakdown of ownership, design, year built, and contract duration, the founders eliminate the 'black box' risk often associated with large industrial conglomerates. The use of market-adjusted equity figures is also a sophisticated touch, as it acknowledges that accounting book value often lags behind the real-world value of specialized maritime assets.
Furthermore, the clear use of proceeds on Slide 6 is exemplary. Investors hate ambiguity regarding where their money is going. By explicitly stating that the funds will retire the OLSH01 PRO bonds, Olympic demonstrates a clear path to debt maturity management, which is the primary concern for fixed-income investors.
What is Missing from the Deck
While the deck is comprehensive for its purpose, it lacks a sensitivity analysis or stress test . In 2014, the offshore market was at a peak. The deck assumes continued high utilization and stable day rates. There is no slide addressing what happens to the NOK 4.9 billion backlog if oil prices drop significantly (which they did shortly after this presentation). A 'downside scenario' slide would have provided a more balanced view of risk.
Additionally, the Risk Factors section is mentioned in the table of contents (Slide 30 and 40) but is not included in the provided slides. For a bond issue of this magnitude, the specific legal and operational risks—such as counterparty risk with charterers like Petrobras—are vital for a complete evaluation.
Lessons for Other Founders
Founders in capital-intensive industries (energy, manufacturing, logistics) should study how Olympic visualizes their pipeline . The contract coverage chart on Slide 16 is a perfect way to show 'Revenue Certainty.' If you have signed contracts or LOIs, do not just list the total value; show the timeline. It proves you have a multi-year runway of work already secured.
Another lesson is the professionalization of the management slide . Instead of just listing titles, Olympic lists specific years of experience and relevant previous employers (JPMorgan, GE Capital, Aker Yards). This builds 'institutional credibility,' which is different from 'startup hustle.' When asking for hundreds of millions of dollars, you need to prove you have handled that scale of capital before.
Finally, the corporate structure diagram on Slide 6 is a must-copy for any founder with a complex parent-subsidiary setup. It clearly shows where the 'Issuer' sits in relation to the 'Holdco' and the 'Operating Companies,' ensuring there is no confusion about which entity is legally responsible for the debt.
Frequently asked questions
- What is the specific financial 'ask' in this presentation?
- The deck specifies a 'NOK 500 million Contemplated Bond Issue' for Olympic Ship AS. According to Slide 6, a portion of these proceeds is intended to repay the outstanding OLSH01 PRO bonds, which had a NOK 350 million amount outstanding. This indicates a refinancing and capital optimization strategy rather than a pure growth-equity round.
- How does the company manage its vessel assets?
- Olympic uses a tiered corporate structure. Olympic Ship AS acts as the issuer and holding entity for various vessel-owning subsidiaries, many structured as 'KS' companies with varying ownership percentages (ranging from 30% to 100%). Technical and commercial management is centralized under Olympic Shipping AS, while crewing is handled by Olympic Crewing AS (Slide 6 and 11).
- Who are the primary customers for Olympic Shipping?
- The company serves major global energy and subsea players. Slide 16 lists charterers including Petrobras (Brazil), Statoil (North Sea), BP, Centrica, and Oceaneering. The contract coverage shows a heavy concentration in the North Sea and Brazil, providing geographic diversification across key offshore oil and gas hubs.
- What is the state of the company's balance sheet at the time of the pitch?
- As of Q1 2014, the company reported total assets of NOK 8.146 billion. The fleet's market value was estimated at NOK 8.1 billion, significantly higher than the book value of vessels (NOK 6.521 billion). This valuation supports a market-adjusted equity ratio of 49%, providing a cushion for bondholders (Slide 21).
- What market trends were they betting on in 2014?
- The company was betting on continued expansion in the subsea sector. Slide 31 highlights a subsea order book of 115 vessels against a current fleet of 457, representing 25% growth. They specifically noted high growth projections for 'Cable, Umbilicals & FP/Flowline Lay' vessels at 47%.