The OLB Group investor deck outlines a mature fintech business model centered on becoming a comprehensive Payment Facilitator (PayFac) for small and medium-sized businesses (SMBs). Operating under the Nasdaq ticker OLB, the company emphasizes its footprint of over 2,000 merchants across 130 industry types. The core value proposition lies in their 'Acquisition Strategy,' where they purchase merchant portfolios at low multiples ($3,000-$5,000 per merchant) and migrate them to a cloud-based SaaS stack. By doing so, they aim to increase monthly revenue from a baseline of $150 per SMB. The deck ef…
Key takeaways
- OLB reports having over 2,000 merchants on their gateway across 130+ industry types (Slide 2).
- The company operates as a Payment Facilitator (PayFac), claiming to book all revenues and additional software services directly (Slide 4).
- Transactional margins are clearly defined: on a $100 purchase with a $3.00 processing fee, OLB nets $0.98 in gross profit after bank and card brand costs (Slide 4).
- The bundled SaaS product suite is priced between $99.00 and $199.00 monthly, positioned against a market average of $167.00 to $769.00 (Slide 5).
- A dedicated crowdfunding platform module supports capital raises from $1MM to $50MM across various security types including Reg CF and Reg A+ (Slide 6).
- The acquisition strategy targets merchants 'not on the radar screen of the big processors' with a target purchase price of $3,000 to $5,000 per merchant (Slide 7).
- OLB anticipates a 25% conversion rate of acquired 'low-tech' merchants into their cloud-based platform (Slide 7).
- Public market comparables from January 2021 show OLB with a $32.648M market cap and a 3.41 Price/Sales ratio, significantly lower than peers like Shopify or Bill.com (Slide 8).
Executive Summary: The Fintech Roll-Up
The OLB Group investor deck presents a clear, albeit traditional, fintech roll-up strategy. By focusing on the 'unloved' segment of the merchant market—small businesses with low monthly revenues—OLB positions itself as a digital transformation partner. The deck moves quickly from scale metrics to the mechanics of their revenue model, providing a level of transparency regarding transactional margins that is often missing from early-stage decks. As a Nasdaq-listed entity, the focus is less on 'solving a problem' and more on the efficiency of their 'Acquisition Strategy' and the resulting expansion of their EBITDA.
Slides 1-3: Scale and Market Reach
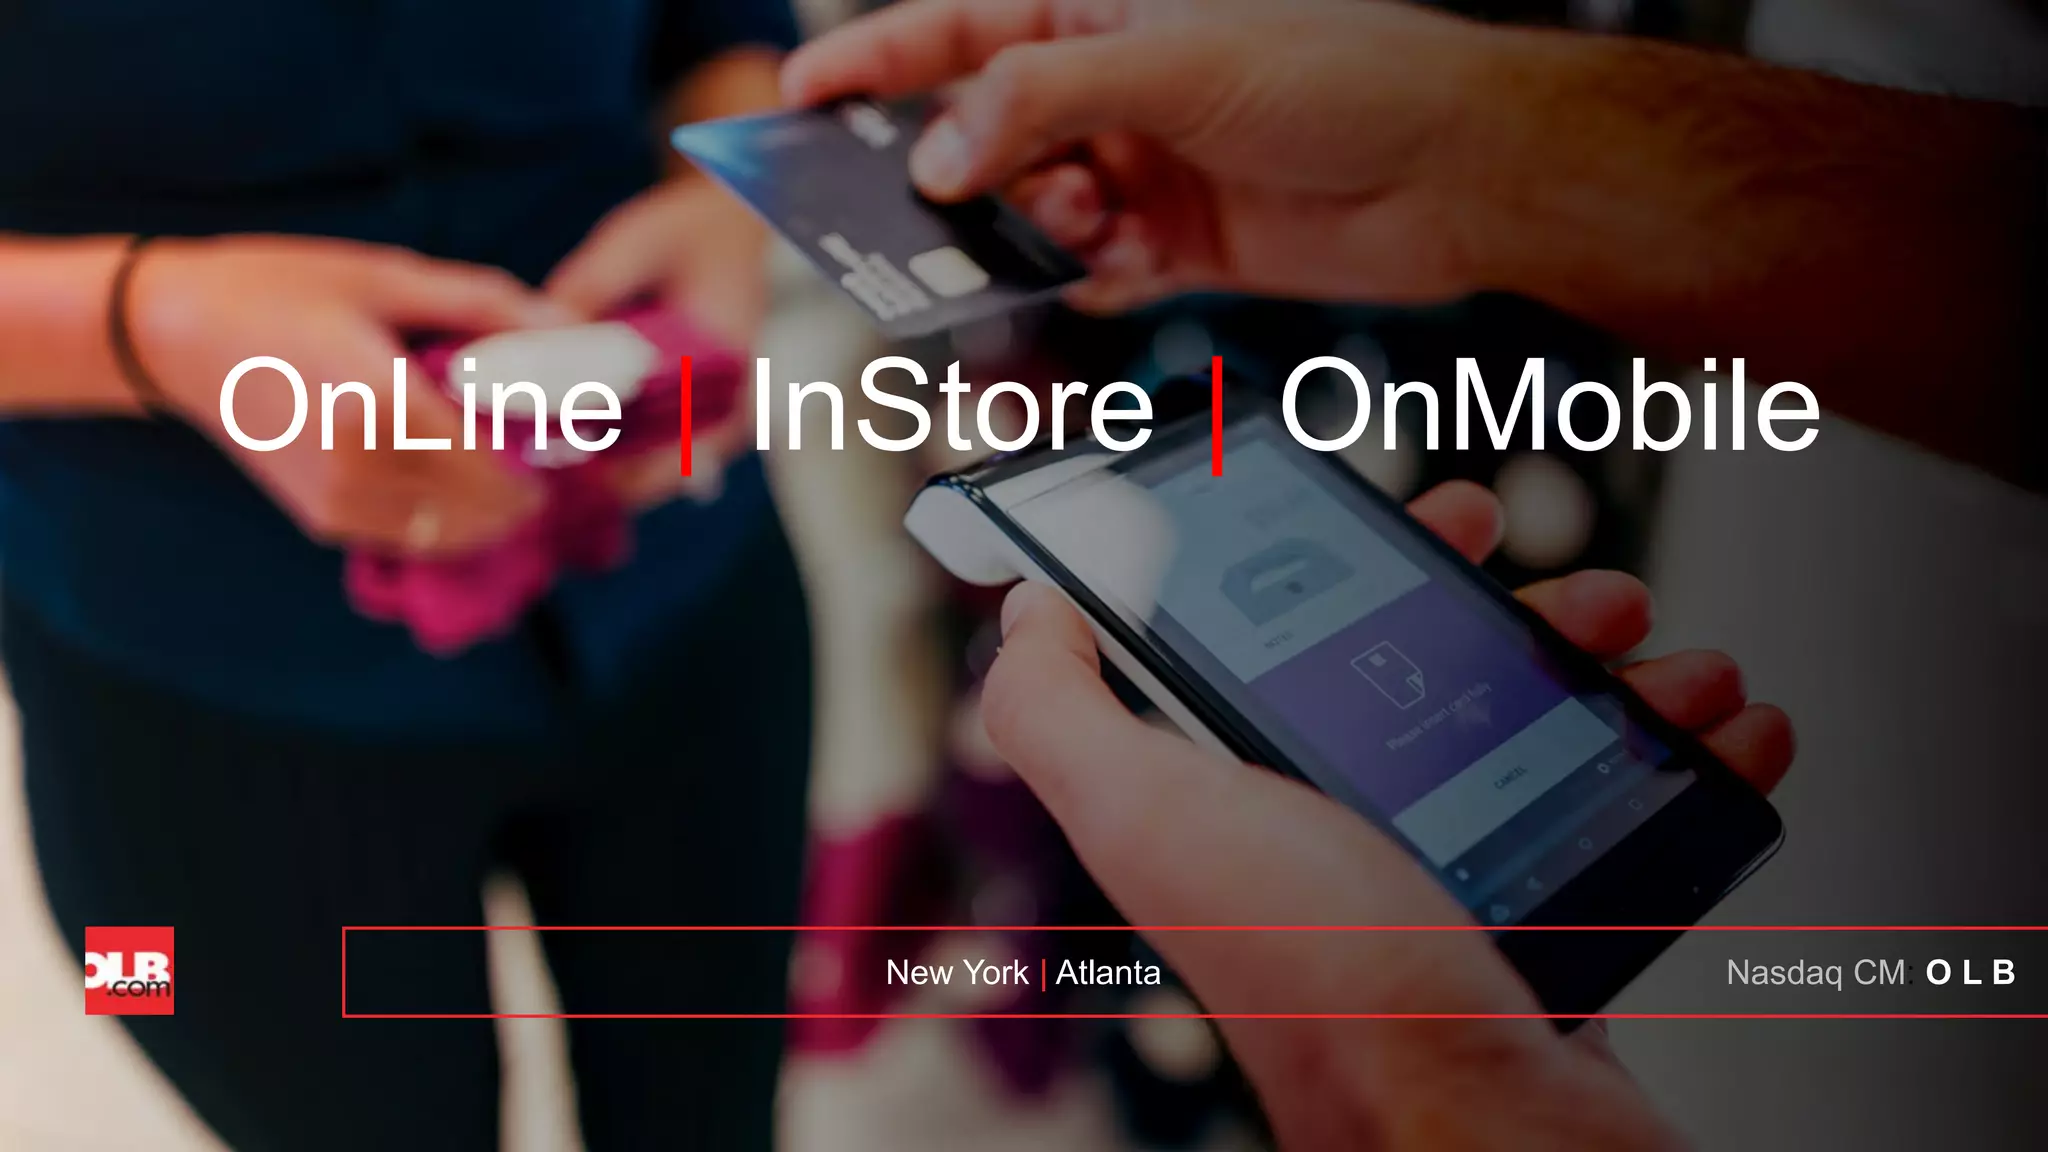
The deck opens with a high-level overview of their service capabilities: OnLine, InStore, and OnMobile. This establishes the 'omnichannel' nature of the business immediately. Slide 2 provides the 'traction' metrics, citing over 2,000 merchants on their gateway. The mention of 130+ industry types and presence in all 50 states suggests a mature infrastructure capable of handling diverse regulatory and operational requirements.
Slide 3 reinforces this diversity with a visual collage and a list of specific target verticals. The inclusion of 'Offices of Lawyers' alongside 'Bars & Taverns' highlights that their software is not just a simple retail POS but a flexible payment settlement layer. This slide serves to de-risk the investment by showing that the company is not overly dependent on a single, volatile industry sector.
Slide 4: The PayFac Mechanics
This is arguably the most important slide in the deck for a financial analyst. It breaks down the 'Business Flow' of a Payment Facilitator into five steps: Master Merchant ID, Hosted App Submission, Management Portal, Automated Underwriting, and Live Processing. The claim that they can move from application to processing in 'as little as one day' is a key competitive advantage in the SMB space.
The bottom half of Slide 4 provides a 'Gross vs Net' revenue demonstration. It tracks a $100 consumer purchase through the ecosystem. It explicitly lists the costs: $0.01 for sponsorship, $0.05 for data processing, $0.12 for card brands (Visa/Mastercard), and $1.84 for the issuing bank. By showing a $0.98 gross profit on a $3.00 fee, OLB demonstrates a 32.6% gross margin on processing revenue. The note that they 'book all revenues' under the PayFac model is a crucial accounting distinction that impacts how their top-line growth is perceived by the market.
Slide 5: Pricing and Competitive Positioning
Slide 5 addresses the 'SaaS' component of their revenue. They list five core products: Web-Site Builder, Marketing Tools, POS System, Gift & Loyalty Cards, and Payment Gateway. By comparing their bundled price ($99 - $199) to the 'Average Market' price ($167 - $769), they create a compelling value proposition for cost-conscious SMBs. However, the deck does not name the specific competitors used to derive the 'Average Market' figures, which is a common omission in such comparisons.
Slide 6: The Crowdfunding Vertical
Interestingly, the deck introduces a 'Crowdfunding Platform' as a distinct product offering. This module supports capital raises from $1MM to $50MM and handles the technical requirements for 506c, Reg CF, Reg A+, and S-1 filings. The inclusion of AML/KYC, investor verification, and escrow account management suggests that OLB is attempting to capture the entire lifecycle of a business, from initial funding to daily payment processing. This adds a layer of 'stickiness' to their ecosystem, though it is unclear from the slides how much of their current 2,000-merchant base actually utilizes this specific service.
Slide 7: The Acquisition Strategy
Slide 7 outlines the company's engine for growth. They target merchant portfolios that are 'not on the radar screen of the big processors.' The economics are specific: they buy portfolios where merchants produce ~$150 in monthly revenue, paying between $3,000 and $5,000 per merchant. This represents a roughly 20x to 33x monthly revenue multiple for acquisition. The goal is to convert 25% of these 'low-tech' merchants into their higher-margin cloud-based services, effectively increasing the LTV (Lifetime Value) of the acquired assets through technology integration.
Slide 8: Public Market Comparables
The final slide provided is a 'Comps' table dated January 15, 2021. It lists OLB alongside industry giants like Shopify (SHOP), Square (SQ), and Bill.com (BILL). The data shows OLB trading at a 3.41 Price/Sales ratio, while Shopify was at 58.76 and Bill.com at 64.15. This slide is a classic 'valuation gap' play, suggesting to investors that OLB is significantly undervalued relative to its peers in the fintech and e-commerce space. It also highlights that OLB was EBITDA positive ($64,274) at the time, whereas many of the larger peers were reporting significant losses.
What Works in This Deck
Granular Financials: The breakdown of the $3.00 processing fee on Slide 4 is excellent. It removes the mystery of how a payment processor actually makes money and where the leakages occur. · Clear M&A Logic: The acquisition strategy on Slide 7 is easy to understand. It defines the target (low-tech SMBs), the price point ($3k-$5k), and the value-add (cloud migration). · Bundled Value Prop: Slide 5 makes a very clear case for why a merchant would choose OLB over a fragmented stack of other SaaS tools.
What is Missing from This Deck
Churn Metrics: While the deck mentions acquiring merchants, it does not disclose the churn rate of their existing 2,000+ merchants. In the SMB space, churn is often the primary headwind. · Team Slide: The provided slides do not include a team or leadership overview. For a company focused on M&A and technical integration, the pedigree of the executive team is vital. · Use of Proceeds: There is no 'Ask' slide in this selection. While we know they are public, a deck used for a capital raise should specify how the new funds will be allocated (e.g., 'X amount for merchant portfolio acquisitions'). · Technology Depth: The deck describes the products but doesn't explain the underlying technology or proprietary nature of their gateway.
Founder Takeaways
Show the math on your margins. If you are in a transactional business, do not just say 'we take a 3% fee.' Use a slide like OLB's Slide 4 to show exactly who gets paid what. It builds immense credibility with sophisticated investors.
Define your 'Unfair' Acquisition Channel. OLB doesn't just say they will 'get more customers.' They define a specific niche (low-tech merchants under the radar of big players) and a specific price they are willing to pay. If you have a repeatable way to 'buy' growth, document it clearly.
Use Comps to highlight a specific narrative. OLB didn't just list competitors; they listed competitors with astronomical P/S ratios to highlight their own 'affordability' as a stock. When building a comps slide, ensure the metrics you choose (like Price/Sales or EBITDA) actually support the story you are trying to tell about your valuation.
Frequently asked questions
- What is OLB's primary growth lever according to the deck?
- OLB relies on an M&A-heavy acquisition strategy. They specifically target small merchant portfolios that produce roughly $150 in monthly revenue and are overlooked by major processors. By purchasing these merchants for $3,000 to $5,000 each, they aim to apply their own technology stack to improve profitability and enterprise value, expecting to convert 25% of these acquisitions to their cloud services.
- How does OLB justify its pricing model to potential merchants?
- The deck uses a 'Market Price' comparison slide to show that purchasing individual SaaS tools (website builder, POS, marketing tools, etc.) separately costs between $167 and $769 per month. OLB offers a bundled price of $99 to $199, positioning themselves as the 'Affordable Price' leader for SMBs needing a full digital suite.
- What specific industries does OLB target?
- Slide 3 lists a diverse range of service-based industries, including snack and non-alcoholic beverage bars, automotive repair, health and personal care stores, restaurants, bars, ambulatory health services, and law offices. This breadth is intended to show the versatility of their payment gateway and POS systems.
- How does the PayFac model differ from their retail merchant portfolio?
- On Slide 4, OLB demonstrates that the PayFac model allows them to book the full $3.00 processing fee as revenue, whereas their retail portfolio only nets $0.98 in revenue for the same transaction. While the gross profit ends up similar ($0.98 vs $0.88), the PayFac status gives them greater control over the merchant relationship and top-line reporting.
- What is the status of the company's public listing in this deck?
- The deck explicitly identifies the company as 'Nasdaq CM: OLB' on the title slide. Slide 8 provides a snapshot of their public valuation as of January 15, 2021, noting a market cap of $32.648 million. This indicates the deck was likely used for secondary offerings or investor relations rather than an initial seed round.