Cypress Development Corp.’s 2018 investor presentation is a highly technical document tailored for institutional and retail investors in the mining sector. Rather than the narrative-driven style of a typical tech startup deck, this presentation focuses on geological feasibility, regulatory tailwinds, and precise unit economics. The company highlights its speed, moving from drilling to a Preliminary Economic Assessment (PEA) in under two years. With a market capitalization of $18.7 million at the time of the deck, the presentation leans heavily on the 'Critical Mineral' designation by the US g…
Key takeaways
- The company achieved a transition from drilling to a Preliminary Economic Assessment (PEA) in less than two years (Slide 1).
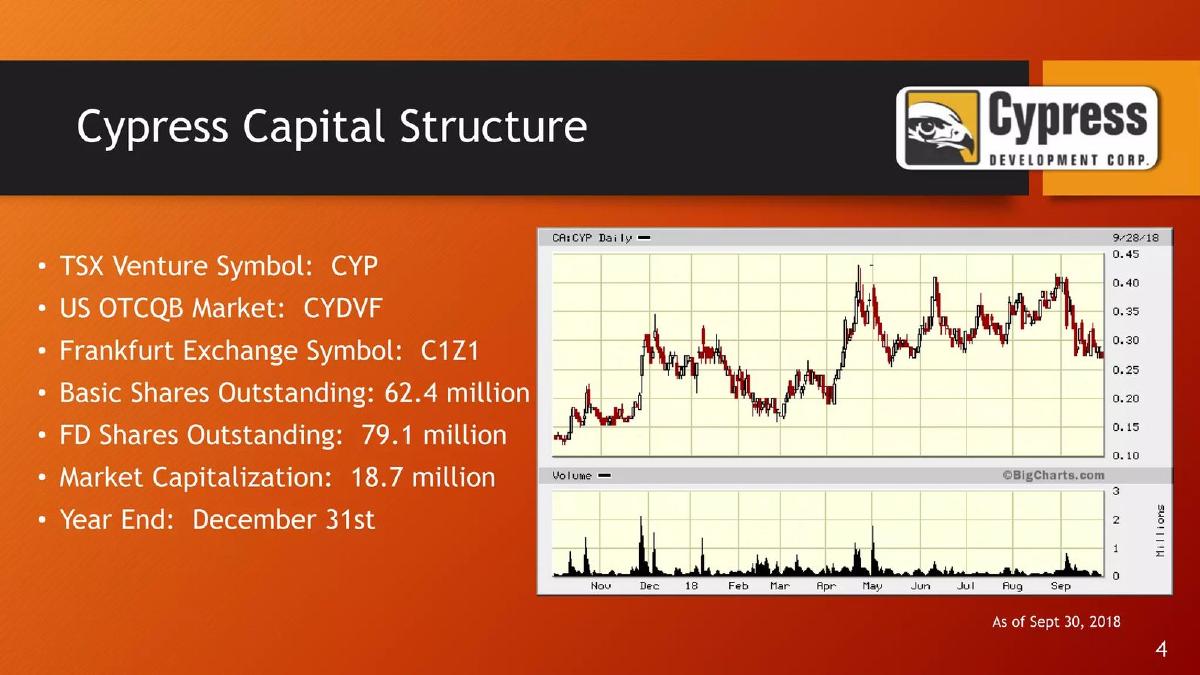
- As of September 30, 2018, the company had a market capitalization of $18.7 million with 62.4 million basic shares outstanding (Slide 4).
- The project leverages a 2017 US Government designation of Lithium as a 'Critical Mineral' to emphasize domestic supply chain security (Slide 7).
- The Clayton Valley property consists of 5,700 acres of 100% owned placer and lode claims (Slide 10).
- Mining operations are designed for soft material, requiring no drilling or blasting, with a pit depth of 120m (Slide 13).
- The total estimated operating cost (OPEX) is $17.50 per tonne of mill feed or $3,983 per tonne of LCE (Slide 19).
- Reagents and supplies constitute the largest portion of operating costs at $2,893 per tonne of LCE (Slide 19).
- 2018 market data shows electric vehicles accounted for 61% of battery-related lithium demand (Slide 22).
Executive Summary: A Resource-Heavy Investor Presentation
The Cypress Development Corp. investor presentation from October 2018 is a classic example of a natural resources sector deck. Unlike software-as-a-service (SaaS) pitches that focus on user acquisition and churn, this deck focuses on geological certainty, chemical processing efficiency, and macroeconomic tailwinds. The company positions itself as a fast-moving developer in the Clayton Valley, Nevada, a region synonymous with American lithium production.
Slide 1: Title and Speed to Milestone
The cover slide establishes the company's primary claim to fame: 'From Drilling to PEA in under 2 Years.' This is a critical metric in the mining industry, where permitting and exploration can often drag on for a decade. By highlighting this speed, Cypress signals operational efficiency. The slide also lists its three exchange listings (TSX-V, OTCQB, and Frankfurt), signaling to investors that the company has global liquidity. The market capitalization is stated at $18.7 million, providing an immediate valuation anchor for the reader.
Slide 4: Capital Structure and Market Performance
This slide provides a transparent look at the company's equity. With 62.4 million basic shares and 79.1 million fully diluted shares, the 'overhang' of warrants or options is visible but not excessive for a junior miner. The inclusion of a year-long stock chart (November 2017 to September 2018) shows a generally upward trend with significant volume spikes. This transparency is standard for public companies but serves as a 'traction' slide for mining investors, showing that the market is reacting to company news.
Slide 7: The Macroeconomic Thesis
Cypress leans heavily on the regulatory environment. By quoting a December 2017 Executive Order that designated lithium as a 'Critical Mineral,' the company aligns its success with US national security and domestic policy. This is a sophisticated way of saying the project is 'too strategic to fail,' or at the very least, that it will face a more favorable permitting and funding environment than a foreign project might.
Slide 10: Project Location and Ownership
The 'Project Location' slide is essential for verifying the asset. The deck confirms 100% ownership of 5,700 acres. A key financial detail hidden here is the 3% NSR (Net Smelter Return) royalty, with a buy-down option to 1% for $2 million. For an analyst, this is a vital piece of the valuation puzzle, as royalties directly impact the net present value (NPV) of a mining project. The map shows proximity to 'Silver Peak,' which is Albemarle's existing lithium operation, implying the geological 'neighborhood' is proven.
Slide 13: Mining Methodology
This slide moves into the technical feasibility of the project. The most important takeaway here is the phrase 'Soft material, no drilling and blasting.' In mining, the hardness of the rock dictates the cost of extraction. By identifying the material as soft, Cypress justifies its low mining cost estimates. The slide also notes a very low waste-to-feed ratio (<0.1), meaning almost everything they dig up is processed, minimizing the cost of moving 'dead' rock.
Slide 16: Process Flow Sheet
Slide 16 is a highly technical engineering diagram of the 'Leach circuit.' While likely incomprehensible to a generalist investor, its presence serves a purpose: it demonstrates that the company has moved beyond theoretical geology into chemical engineering. It details the use of agitated tanks, pH and temperature control, and steam heat. This level of detail is intended to de-risk the 'how' of the project for technical due diligence teams.
Slide 19: Operating Cost Estimate (Unit Economics)
This is the most critical slide for financial modeling. Cypress breaks down its OPEX into granular detail. The total OPEX of $3,983 per tonne of LCE is the 'magic number' investors will compare against the current market price of lithium. Notably, 'Reagents & supplies' make up 72% of the total cost ($2,893). This tells an investor that the project's profitability is highly sensitive to the price of chemicals (likely sulfuric acid) rather than labor or power costs.
Slide 22: Supply and Demand Dynamics
The final slide in this selection provides the 'Why Now?' context. It breaks down the 2018 lithium demand of 248,583 tonnes. The flow chart shows how demand funnels from total lithium to batteries, and finally to Electric Vehicles (61%). By showing that EVs are the primary driver of battery demand, Cypress connects its Nevada dirt to the global transition to green energy.
What Works in This Deck
Granular Cost Transparency: Most early-stage companies hide their cost structures. Cypress puts its $3,983/tonne LCE estimate front and center on Slide 19. This allows investors to immediately run their own sensitivity analyses against fluctuating lithium prices.
Strategic Alignment: The use of the 'Critical Mineral' designation (Slide 7) is a powerful narrative tool. It transforms a speculative mining play into a patriotic investment in US infrastructure and supply chain security.
Technical Validation: Including the process flow sheet (Slide 16) and mining specs (Slide 13) shows that the company has done the hard engineering work. It moves the conversation from 'if' there is lithium to 'how' it will be extracted.
What Is Missing from the Deck
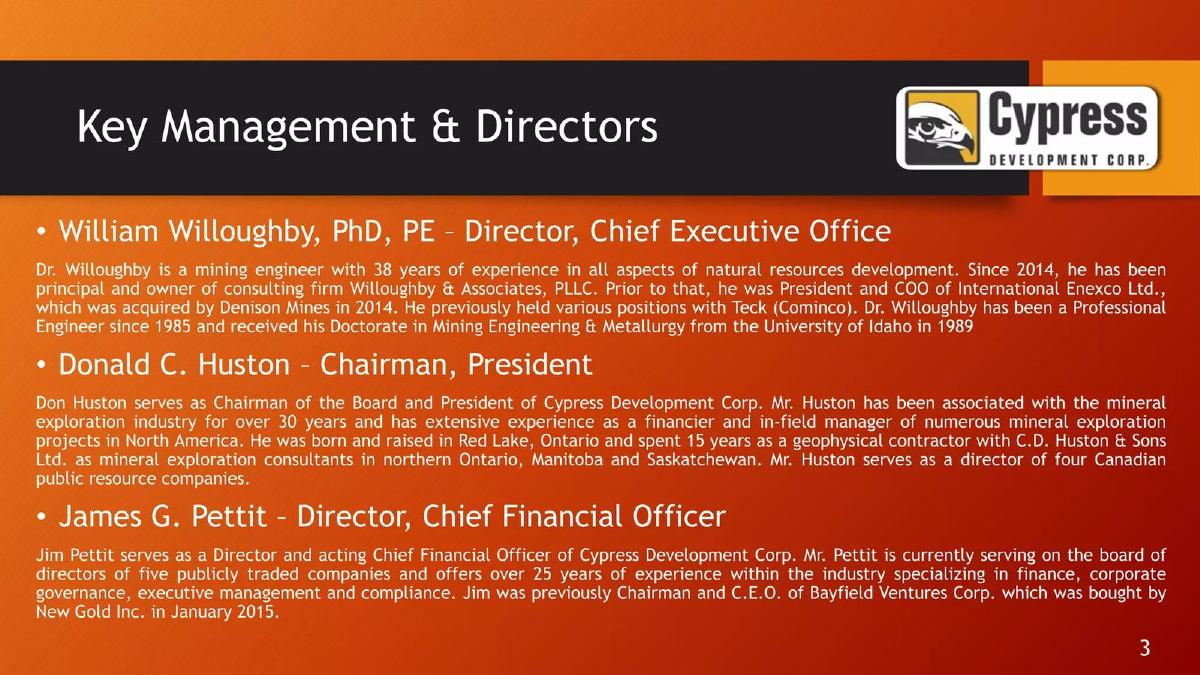
Management Team: In the eight slides provided, there is no mention of the leadership team. In junior mining, the 'jockey' is often as important as the 'horse.' Investors need to know if the management has successfully built or sold mines before.
Environmental and Social Impact: Mining in Nevada, even on 'soft material,' involves significant water usage and environmental footprints. There is no mention of water rights or community relations, which are often the biggest hurdles to actual production.
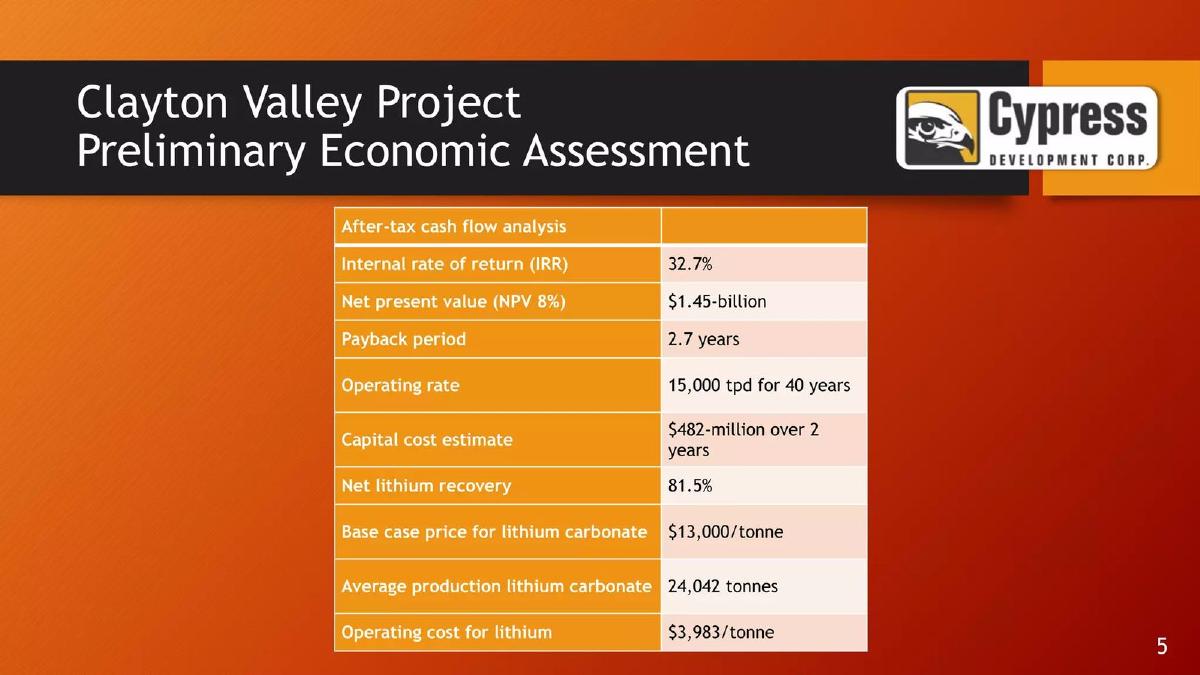
Capital Expenditure (CAPEX): While the deck provides Operating Costs (OPEX), it omits the Capital Expenditure (CAPEX) required to build the mill and acid plant. An investor cannot calculate a Return on Investment (ROI) without knowing how many hundreds of millions of dollars are needed to start the operation.
What a Founder Should Copy
The 'Neighborhood' Effect: If your startup is located near a giant in the industry (like Cypress is near Albemarle's Silver Peak), show it on a map. Proximity to success is a powerful heuristic for investors.
Regulatory Tailwinds: Don't just talk about your product; talk about the laws and government policies that make your product inevitable. Cypress does this perfectly with the 'Critical Mineral' slide.
Unit Economics: Every founder should have a slide as clear as Slide 19. Whether you are selling software or lithium, you must be able to break down your cost per unit into its constituent parts (labor, supplies, power, etc.).
Frequently asked questions
- What is the primary value proposition of the Clayton Valley project?
- The primary value proposition is the combination of a strategic domestic location in Nevada and a low-cost mining profile. Slide 13 notes that the material is 'soft,' meaning no drilling or blasting is required, which significantly reduces extraction costs. Furthermore, Slide 7 highlights that the US government favors domestic sources to reduce vulnerability to supply chain disruptions.
- How does the company plan to manage its royalties?
- According to Slide 10, the property currently carries a 3% Net Smelter Return (NSR). However, the company has a structured option to buy this down to a 1% NSR for a payment of $2 million, which would improve the long-term profitability and attractiveness of the project to future partners or acquirers.
- What are the specific components of the lithium extraction operating costs?
- Slide 19 breaks down the $3,983 per tonne LCE cost into five categories: Reagents & supplies ($2,893), Mining ($395), Plant labor ($330), Power ($210), and G&A ($155). Reagents represent the vast majority of the spend, indicating that chemical processing is the primary cost driver rather than physical extraction.
- What was the market sentiment regarding Cypress Development Corp. in late 2018?
- Slide 4 shows a stock chart from late 2017 through September 2018. The stock experienced significant volatility, rising from approximately $0.10 to peaks near $0.45 in May and September 2018. This suggests high investor interest and trading volume (peaking at over 3 million shares) coinciding with project milestones like the PEA.
- Who is the target audience for this lithium production?
- Slide 22 identifies the market split for lithium. While 37% of total demand goes to glass and ceramics, the growth engine is batteries. Within the battery segment, 61% of demand is driven by Electric Vehicles, followed by 30% for LCO (Lithium Cobalt Oxide) batteries used in consumer electronics.