The VTEX pitch deck from 2019 serves as a definitive blueprint for later-stage enterprise SaaS companies. At the time of this deck, the company reported $66MM in ARR with a consistent 44% CAGR over six years. What sets this deck apart is its aggressive transparency regarding capital efficiency, explicitly comparing its $7MM total capital raised to reach $52MM in ARR against industry medians that require $41MM for similar milestones. The narrative shifts from 'solving a problem' to 'dominating a category,' utilizing third-party validation from Gartner and IDC to cement its status as a major pl…
Key takeaways
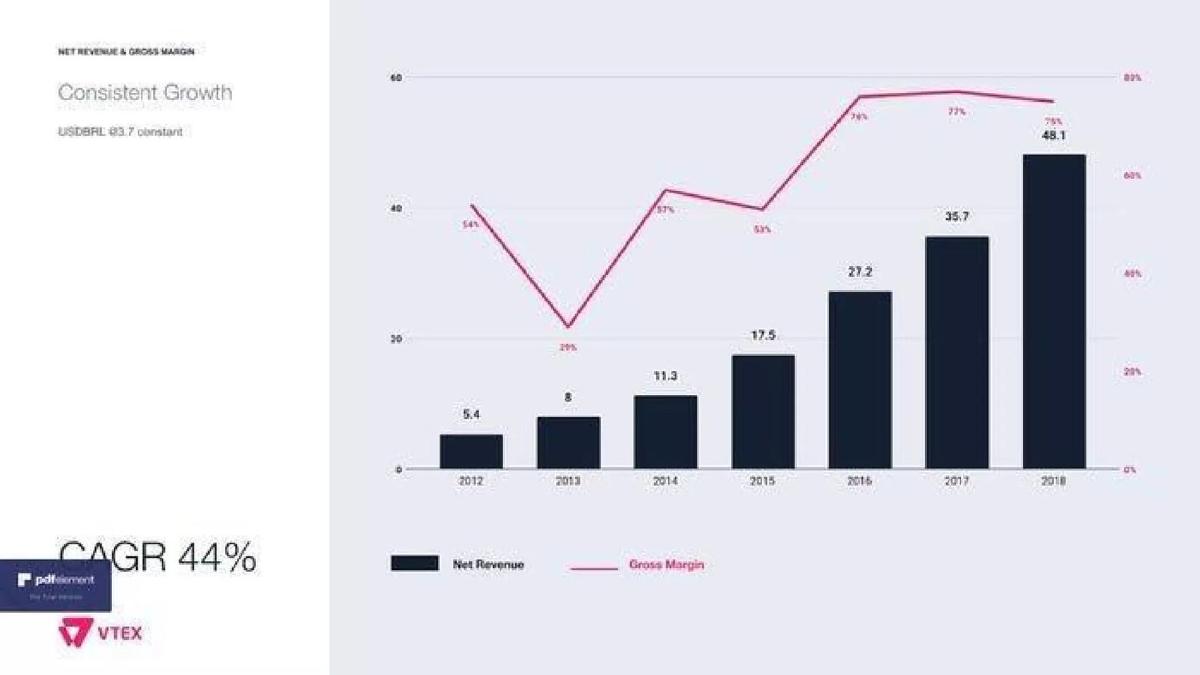
- The company achieved a 44% CAGR over six years, reaching $48.1MM in net revenue by 2018 (Slide 6).
- VTEX demonstrates extreme capital efficiency, reaching $52MM in ARR with only $7MM in total capital raised (Slide 7).
- The platform manages significant scale, handling 1.6 million peak orders per hour on a unique set of servers (Slide 10).
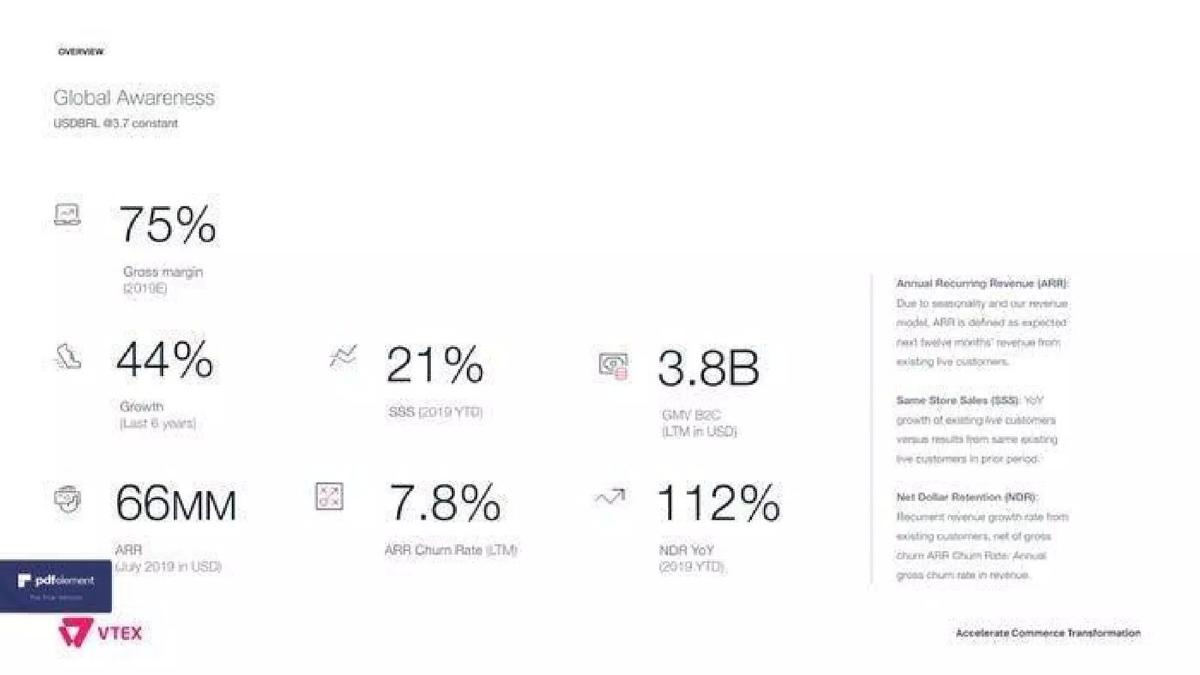
- Net Dollar Retention (NDR) stands at 112% year-to-date for 2019, indicating strong expansion within the existing customer base (Slide 3).
- The deck leverages heavy third-party validation, featuring both the IDC MarketScape and Gartner Magic Quadrant (Slides 8 and 9).
- Technical differentiation is centered on a 'true multi-tenant' architecture, contrasted against traditional single-tenant cloud setups (Slide 17).
- The pricing model is transparently tiered, ranging from a $500/month 'On Demand' plan to a $4,500/month 'Enterprise' plan with varying revenue shares (Slide 13).
- Growth is visualized through a GMV cohort analysis, showing consistent expansion from every quarterly cohort since 2015 (Slide 14).
Introduction: The Later-Stage Power Play
The VTEX pitch deck from 2019 is not a typical startup presentation. By the time this deck was circulated, VTEX was already a global force in e-commerce, boasting a $66MM ARR and a client list that includes Whirlpool, Sony, and Walmart. This teardown examines how a mature company uses data-heavy slides to justify a massive $365 million funding round. The deck moves away from the 'problem/solution' narrative of early-stage startups and focuses instead on operational excellence, technical moats, and market dominance.
Slides 1-2: The Hook and Social Proof
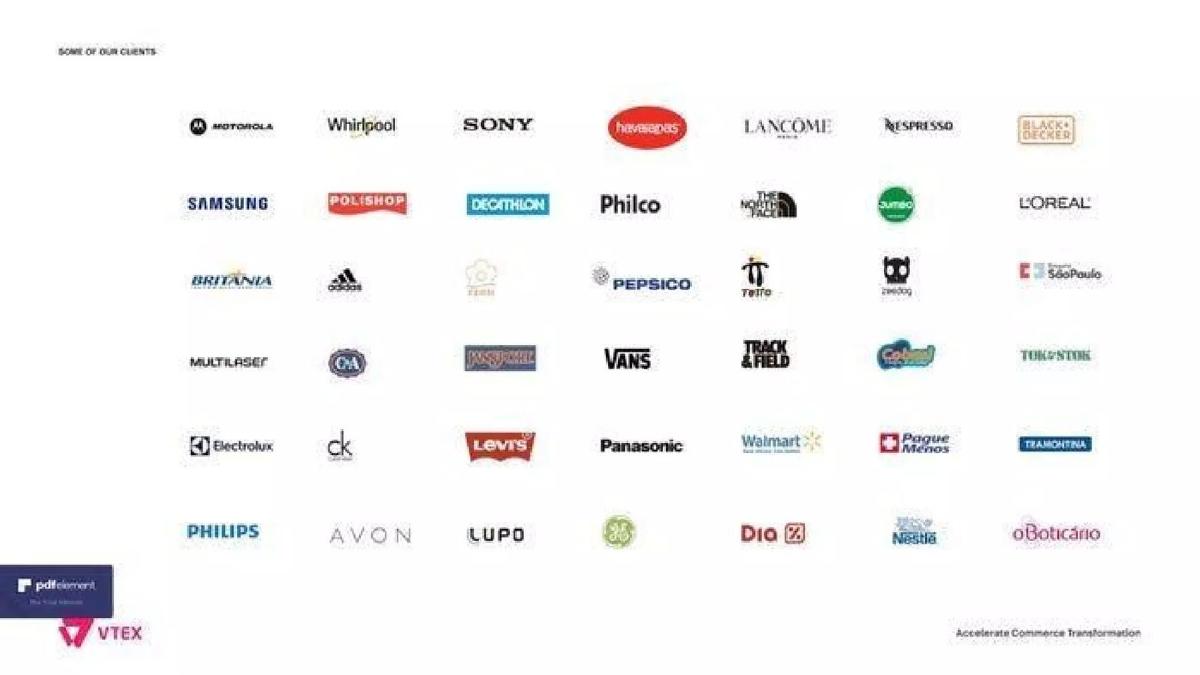
The deck opens with a minimalist title slide: "Accelerate Commerce Transformation." It establishes a professional, enterprise-grade tone immediately. However, the real work begins on Slide 2. Instead of explaining what they do, VTEX presents a wall of logos. This is a classic 'trust' slide. By showing brands like Motorola, Samsung, Adidas, Levi's, and PepsiCo, VTEX eliminates the need to prove product-market fit. The message is clear: the world's largest brands already trust us.
Slides 3-4: The Global Snapshot
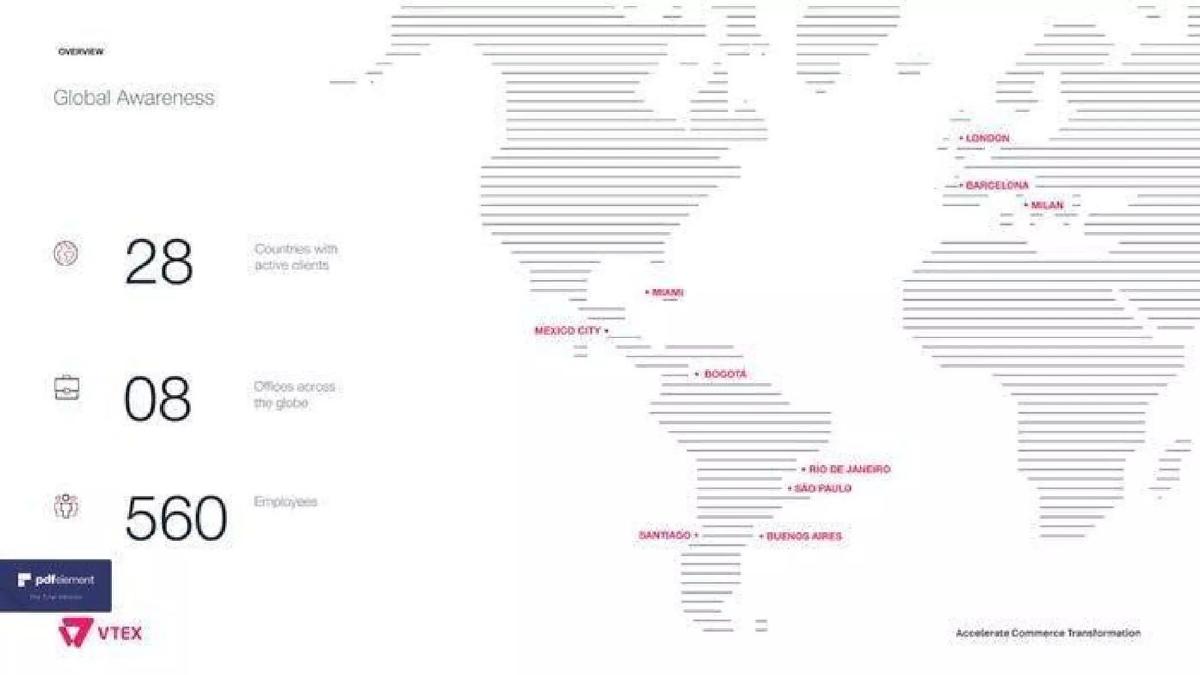
Slide 3, titled "Global Awareness," is a masterclass in metric density. It lists a 75% gross margin (2019E), 44% growth over the last six years, and a $66MM ARR as of July 2019. Crucially, it includes 112% Net Dollar Retention (NDR) . For SaaS investors, NDR is the gold standard; anything over 100% means the company grows even if it doesn't add a single new customer. Slide 4 provides the geographic context: 28 countries with active clients, 8 offices, and 560 employees. The map shows a heavy concentration in Latin America and Europe, signaling a clear path for further North American expansion.
Slide 5: The Founders
The founders' slide features Geraldo Thomaz and Mariano Gomide, both co-CEOs. The bios emphasize their technical and academic backgrounds (Mechanical Engineering at UFRJ) and their long-term commitment to the SaaS model. This slide serves to humanize the massive metrics shown previously, showing that the company is still led by its original visionaries who have a deep understanding of R&D and global sales.
Slides 6-7: Financial Performance and Capital Efficiency
Slide 6 visualizes the 44% CAGR mentioned earlier. The bar chart shows net revenue growing from $5.4MM in 2012 to $48.1MM in 2018. The overlaying line graph for Gross Margin shows a steady climb, stabilizing around 75%. This indicates that as the company scales, it is becoming more profitable, not less.
Slide 7 is the 'hero' slide of the deck. Titled "Capital Efficiency," it compares VTEX to industry medians sourced from KeyBank Capital Markets. The table shows that while the median participant needs 9 years and $41MM in capital to reach $50MM in ARR, VTEX reached $52MM in ARR in the same timeframe but with only $7MM in total capital raised . This is an extraordinary claim of efficiency that suggests the company has a massive 'unfair advantage' in its sales process or product architecture.
Slides 8-9: Third-Party Validation
VTEX leans heavily on external analysts to define its market position. Slide 8 features the IDC MarketScape for Worldwide SaaS and Cloud-Enabled B2C Digital Commerce Platforms, placing VTEX among 'Major Players.' Slide 9 shows the Gartner Magic Quadrant , where VTEX is positioned as a 'Niche Player' but trending toward the 'Visionaries' quadrant. Using these charts allows VTEX to bypass the 'competitor' slide common in smaller decks; they aren't comparing themselves to startups, they are comparing themselves to Oracle, SAP, and Salesforce.
Slides 10-12: The Product Differential
Slide 10 introduces the technical 'Differentials.' It highlights 12,000+ releases per year and an average of 109 days to go-live. The most impressive stat here is 1.6M peak orders per hour . This proves the platform can handle the most extreme retail events, like Black Friday. Slide 11 and 12 broaden the scope, stating "All we do is commerce," covering digital, brick-and-mortar, marketplace, and B2B. They emphasize 'out-of-the-box' and 'low-code' features, which are key selling points for enterprise IT departments looking to reduce total cost of ownership (TCO).
Slides 13-14: Pricing and Cohorts
Slide 13 provides a rare look at enterprise SaaS pricing. It shows four tiers: On Demand, Business, Corporate, and Enterprise. The pricing is a hybrid of a fixed monthly fee ($500 to $4,500) and a revenue share (2.5% down to 0.5%). This 'aligned revenue model' ensures that VTEX wins when its customers win. Slide 14 supports this with a GMV Cohort chart . The 'layer cake' visualization shows that every quarterly cohort since 2015 is growing in volume, proving the 112% NDR mentioned on Slide 3.
Slides 15-20: Technical Deep Dive
This section of the deck targets the technical due diligence team. Slide 15 explicitly states they build the "infrastructure for global commerce." Slide 17 explains the "True multi-tenant" architecture, using a diagram to show how shared infrastructure leads to better scalability than the isolated 'not a multi-tenant' models used by older competitors. Slide 18 uses a Black Friday vs. Regular Friday graph to show their autoscaling cloud capabilities, noting a peak of 633 orders per minute. Slide 19 and 20 introduce VTEX IO , their serverless, low-code development platform, which allows clients to build custom applications on top of the core VTEX engine.
Slides 21-23: Ecosystem and Vision
Slide 21 illustrates "Data Orchestration," showing how VTEX sits at the center of channels (E-commerce, Social Media, POS) and sources (Warehouses, ERP, Carriers). Slide 22 introduces VTEX inStore , a Smart POS solution that bridges the gap between online and offline shopping. Finally, Slide 23 highlights VTEX DAY , claiming it is the 3rd largest e-commerce event globally. Featuring a photo of a live interview with President Barack Obama and citing 22,000+ attendees, this slide is the ultimate 'flex' of brand authority and ecosystem influence.
What Works in This Deck
Extreme Metric Transparency: By including NDR, GMV cohorts, and capital efficiency ratios, VTEX speaks the language of sophisticated growth investors. · The 'Capital Efficiency' Argument: Slide 7 is a brilliant piece of persuasion. It frames the company not just as a good business, but as a statistically superior one compared to the entire SaaS industry. · Third-Party Authority: Using Gartner and IDC charts provides an objective 'map' of the industry that places VTEX in the big leagues without the founders having to make the claim themselves. · Scale Proof: The Black Friday metrics (Slide 18) and peak order stats (Slide 10) provide concrete evidence that the platform is 'enterprise-ready.'
What Is Missing
The Ask: There is no slide indicating the size of the round, the valuation sought, or the specific use of proceeds. This suggests the deck was used as a general 'investor relations' piece or for a round where the terms were already being negotiated. · Competitive Matrix: While the Gartner/IDC charts show where they sit, there is no detailed breakdown of why a customer would choose VTEX over Shopify Plus or Magento specifically. · Roadmap: The deck is very focused on what VTEX is and what it has done. It lacks a forward-looking product roadmap or a 'Vision 2025' slide. · Unit Economics: While they show revenue and margins, they do not explicitly state Customer Acquisition Cost (CAC) or Lifetime Value (LTV) ratios, though these can be inferred from the cohort and efficiency slides.
What a Founder Should Copy
The Cohort Slide (Slide 14): If you have a recurring revenue model, this 'layer cake' chart is the most effective way to prove retention and expansion. · The Efficiency Benchmark (Slide 7): Don't just say you are efficient; find a credible industry report and show exactly how much less capital you've used to reach your milestones compared to the average. · The Logo Wall (Slide 2): If you have big names, lead with them. It changes the tone of the entire meeting from 'convincing' to 'explaining.' · Technical Moats (Slide 17): If your architecture is a competitive advantage, use simple diagrams to show why 'your way' is better than the 'old way.' VTEX's multi-tenant vs. single-tenant comparison is a perfect example of this.
Frequently asked questions
- How does VTEX define its ARR and revenue growth?
- VTEX defines Annual Recurring Revenue (ARR) as the expected next twelve months' revenue from existing live customers. In July 2019, this figure stood at $66MM. The company reported a 44% CAGR over the last six years, with net revenue growing from $5.4MM in 2012 to $48.1MM in 2018. This growth is supported by a 112% Net Dollar Retention rate, showing that existing customers spend more over time.
- What is the significance of the capital efficiency slide?
- Slide 7 is perhaps the most powerful slide for a sophisticated investor. It compares VTEX's capital consumption against industry benchmarks from KeyBank Capital Markets. While the median participant requires $41MM to reach $50MM in ARR, VTEX reached $52MM in ARR having raised only $7MM. This suggests a highly disciplined management team and a product that sells with lower customer acquisition costs than its peers.
- How does VTEX differentiate its technology from competitors?
- The deck emphasizes a 'true multi-tenant' architecture (Slide 17). It contrasts this against 'not a multi-tenant' setups where brands like Sony or Walmart would have isolated infrastructure. VTEX argues that its shared infrastructure leads to more resiliency, scalability, and efficiency. Additionally, they highlight a microservices architecture with over 70 services and a low-code development platform called VTEX IO (Slides 10 and 20).
- What does the cohort analysis reveal about the business?
- The GMV cohort chart on Slide 14 shows the Gross Merchandise Volume generated by customers based on when they joined the platform. Every quarterly cohort from 2015 through 2018 shows a 'stacking' effect where older cohorts continue to contribute significant volume while new cohorts add incremental growth. This is a classic 'smile' or 'layer cake' chart that indicates low churn and high customer lifetime value.
- What is missing from the VTEX pitch deck?
- The deck is notably missing a specific 'Ask' slide detailing how much they are currently raising and how the funds will be used. It also lacks a detailed breakdown of the competitive landscape beyond the IDC and Gartner charts. While it mentions 560 employees, it does not provide a management organizational chart or a detailed roadmap of future product features, focusing instead on current capabilities and historical performance.