Znak it presented a solution for the 'old dilemma' of digital content: making information both free for users and profitable for providers. Their 2013 deck highlights a SaaS platform that allows users to earn access to premium content through advertising engagement, claiming a 19.6% conversion rate compared to the 1-2% typically seen with standard paywalls. The company positioned itself as a way for publishers to bypass the 30% fees charged by Apple and Google. With 900,000 EUR already invested by 2012, the deck sought new funding to capitalize on a market where 90% of online content was pred…
Key takeaways
- The platform claims a 19.6% conversion rate for content access, significantly higher than the 1-2% cited for traditional paywalls on slide 7.
- Znak it positioned itself as a tool to bypass the 30% in-app payment fees charged by Apple and Google on slide 7.
- The company reported having 900,000 EUR in seed and angel capital invested between 2009 and 2012 on slide 16.
- Market validation is based on a Simon-Kucher & Partners prediction that 90% of online content would be paid by 2016 on slide 10.
- The business model is described as SaaS with no setup costs and up to a 94% return for publishers on slide 13.
- User data on slide 22 shows a small sample size of 1,281 unique buyers, with 50% of users being under 34 years old.
- The deck omits a team slide, a specific funding request amount, and a detailed product roadmap.
- The value proposition centers on 'frictionless' access without the need for registration, PINs, or User IDs on slide 7.
Executive Summary: The Micropayment Dream of 2013
Znak it! entered the market during a pivotal shift in digital media. In 2013, publishers were struggling with the decline of print and the inadequacy of digital display ads. The Znak it deck proposes a 'fair' marketplace where users can trade their attention (via ads) for premium content. While the vision was grand—claiming to make the entire WWW a marketplace—the execution of the deck relies heavily on high-level philosophy and lacks the granular operational data required for a late-seed or Series A round.
Slide 1: The Vision Statement
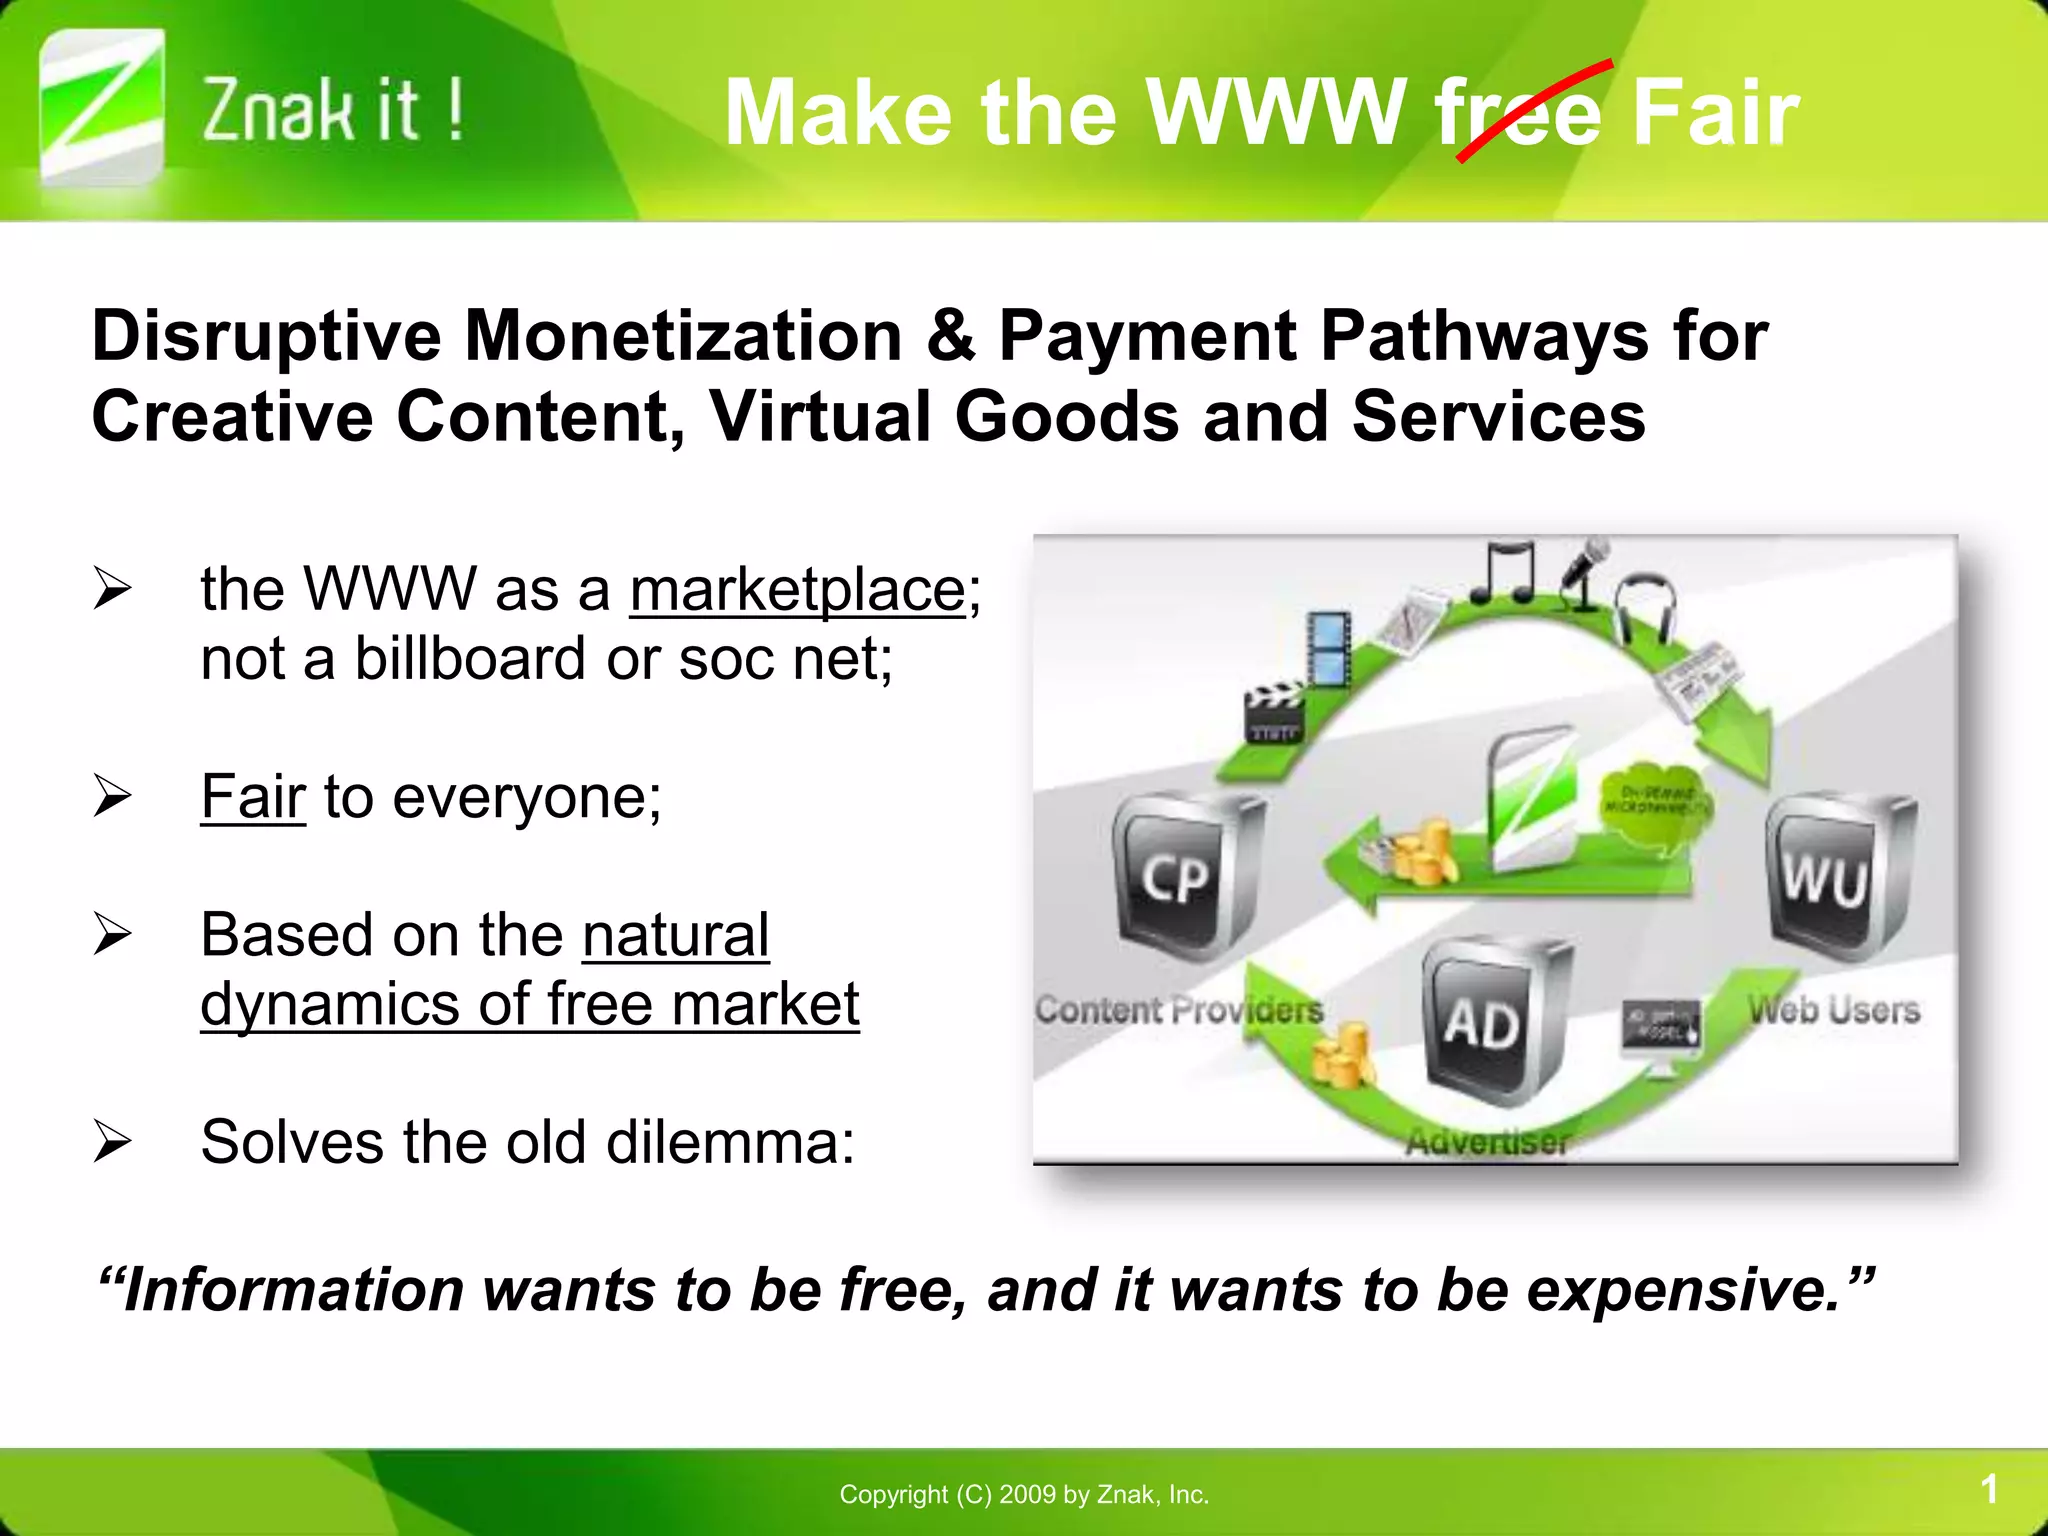
The deck opens with a bold headline: "Make the WWW Fair," with the word "free" crossed out. This immediately establishes the company's stance against the 'everything should be free' culture of the early internet. They define their product as "Disruptive Monetization & Payment Pathways for Creative Content, Virtual Goods and Services." The slide quotes the famous Stewart Brand line, "Information wants to be free, and it wants to be expensive," positioning Znak it as the bridge between these two conflicting desires. The graphic on the right illustrates a circular economy between Content Providers (CP), Web Users (WU), and Advertisers (AD).
Slide 4: The Three-Way Marketplace
This slide breaks down the value proposition for the three pillars of their ecosystem. For Content Providers, it is a "premium content curation and monetization platform." For Web Users, it offers "frictionless access to paid content, also for 'free'" (implying the ad-supported model). For Marketers, it provides a "direct-to-user advertising opportunity & a data collection tool." The use of generic 3D icons is typical of the 2009-2013 era but does little to show the actual product interface.
Slide 7: The 'Earn Free Access' Product
Slide 7 is the most data-rich slide in the set. It showcases a mock-up of an ad-supported content gate featuring Honda and Mazda advertisements. Key claims include:
No registration, PINs, or User IDs required, which they label as "quick, safe and private." · A 19.6% conversion rate, contrasted against a 1-2% industry standard for paywalls. · The ability to bypass the 30% in-app payment fees charged by Apple and Google.
The slide also highlights the 2011 Florin Transaction Services Innovation Award, providing a necessary layer of third-party validation.
Slide 10: Market Opportunity and Timing
Znak it uses external research to justify the 'Why Now?' factor. Citing Simon-Kucher & Partners, the slide claims that 1/5 of online content was paid at the time (a 139% increase) and predicts that by 2016, 90% of online content would be paid. The chart shows a stagnant 'Offline Publishing' market versus a growing 'Internet' market. This slide is intended to create a sense of urgency for investors, suggesting that the transition to paid digital content is inevitable.
Slide 13: Business Model Comparison
This slide uses a side-by-side comparison to position Znak it against traditional paywalls. Traditional paywalls are described as "Expensive, low ROI," "Media/publisher-centric," and creating a "silo effect." In contrast, Znak it is described as a SaaS model with "no setup and system maintenance costs" and "up to 94% return." They emphasize that their technology is "portal-agnostic" and supports "social engagement, content sharing & P2P recommendations." This is a classic 'Us vs. Them' slide designed to highlight competitive advantages.
Slide 16: Financial History and Projections
The financial slide shows a cumulative investment of 900,000 EUR from 2009 to 2012. The area chart tracks three metrics: Seed & Angel Capital (yellow), Revenue from Commission (green), and Operational Expenses (white line). Notably, the green revenue section is very thin compared to the yellow investment section until the 'Estimated' 2013 projection, where revenue is expected to spike. The slide explicitly states, "Does not include the new round," but fails to mention how much that new round is.
Slide 19: The Reiteration of the Value Prop
Slide 19 serves as a summary slide, repeating the "Make the WWW Fair" slogan. It lists four key points: Enormous opportunity, Fair and beneficial to everyone, Customer is King, and Business model driven by real market dynamics. It includes a screenshot of the Znak it website, which shows a laptop displaying the same circular ecosystem graphic from slide 1. The footer reiterates that information can be both free to access and profitable to produce.
Slide 22: User Demographics
The final slide provided focuses on user characteristics. It claims that "Younger users are more likely to convert into Buyers." The data shows that 50% of their users are under 34 years old. However, the total number of unique buyers cited is only 1,281. While the conversion percentages for different age brackets (ranging from 12.9% to 65.3%) look impressive, the small sample size suggests the platform was still in a very early testing phase or had limited distribution at the time of the deck's creation.
What Znak it! Does Well
The deck is very clear about the problem it is solving. The 'old dilemma' of free vs. paid content was a major pain point in 2013 and remains relevant today. By offering a specific alternative (ad-sponsored access) rather than just a better credit card form, Znak it differentiates itself from standard payment processors. The inclusion of the 19.6% conversion rate is a powerful hook, as it represents a 10x improvement over the status quo they cited.
What is Missing from the Deck
The most significant omission is the Team Slide . In early-stage fundraising, the 'who' is often more important than the 'what.' Without knowing the founders' backgrounds in fintech or publishing, it is difficult to assess their ability to execute. Furthermore, the Ask is missing. The deck mentions a 'new round' but doesn't specify the amount, the intended use of funds, or the milestones that the funding will help achieve. Finally, there is no Technical Slide explaining how they actually 'bypass' the 30% Apple/Google fees, which is a claim that usually triggers significant legal and technical scrutiny from investors.
Lessons for Founders
Founders can learn from Znak it's use of comparative metrics . By benchmarking their 19.6% conversion rate against the 1-2% industry standard, they make their value proposition quantifiable. However, founders should avoid the 'Small Sample Size' trap seen on slide 22. Presenting percentages based on only 1,281 buyers can look like 'cherry-picking' data if not framed correctly. Always ensure that your traction data is robust enough to support your growth claims. Lastly, never forget the Team Slide ; investors are buying into people as much as they are buying into a market opportunity.
Frequently asked questions
- What is the core problem Znak it is trying to solve?
- Znak it addresses the 'old dilemma' that information wants to be free for users but expensive (profitable) for creators. According to slide 1, they aim to move the web from a 'billboard' to a 'fair marketplace.' They target the inefficiency of traditional paywalls, which they claim only convert 1-2% of users, by offering an ad-sponsored 'Earn Free Access' model.
- How does Znak it generate revenue for content providers?
- The platform uses a SaaS model that supports various payment methods, including direct payments, donations, and ad-sponsored access. Slide 13 notes that it offers up to a 94% return to providers. By allowing users to engage with ads to unlock content, it creates a 'frictionless' monetization pathway that avoids the high friction of forced registrations and credit card entries.
- What evidence of traction does the deck provide?
- Traction is primarily demonstrated through conversion metrics and historical investment. Slide 7 claims a 19.6% conversion rate and mentions winning the 2011 Florin Transaction Services Innovation Award. Slide 16 shows that 900,000 EUR was invested by 2012, though the revenue line on the chart remains significantly lower than operational expenses during that period.
- Who are the primary stakeholders in the Znak it ecosystem?
- Slide 4 identifies three major stakeholders: Content Providers (who get a premium monetization platform), Web Users (who get frictionless access to paid content, sometimes for 'free' via ads), and Marketers/Advertisers (who receive a direct-to-user advertising opportunity and a data collection tool).
- What are the biggest risks or omissions in this pitch deck?
- The most glaring omission is the lack of a team slide; investors cannot see who is building the technology. Additionally, while slide 16 mentions a 'new round,' it does not specify the amount being raised or the valuation. The user data on slide 22 is also based on a relatively small sample of 1,281 unique buyers, which may not prove scalability.