CPI Card Group’s March 2016 investor presentation depicts a company at the center of the U.S. payment infrastructure. The deck emphasizes their #1 market position in the U.S. prepaid debit card and small issuer markets, alongside a leading role with large issuers. Financially, the company reported $374 million in net sales for FY2015 with a 29% CAGR from 2012-2015. The core narrative focuses on 'highly visible and recurring demand,' noting that 88% of annual demand is driven by the reissuance of existing cards. The presentation also highlights the shift from magnetic stripe cards (ASP $0.20)…
Key takeaways
- CPI Card Group claims the #1 market position in the U.S. Prepaid Debit Card and U.S. Small Issuer markets (Slide 2).
- The company achieved $374 million in Net Sales for FY2015, representing a 29% CAGR since 2012 (Slide 2).
- Approximately 88% of annual card demand is driven by the reissuance of existing cards, providing high revenue visibility (Slide 8).
- The transition to Dual-Interface EMV cards represents a 10x increase in Average Selling Price (ASP) compared to magnetic stripe cards (Slide 10).
- CPI produces approximately 35% of cards in the U.S. financial payment card market (Slide 6).
- The company operates 7 high-security facilities, each certified by one or more major payment card brands (Slide 6).
- Adjusted EBITDA grew at a 52% CAGR from 2012 to 2015, reaching $96 million in FY2015 (Slide 2).
- The deck highlights a 'Card@Once' instant issuance system with an installed base of over 3,900 units at bank branches (Slide 4).
Executive Summary: A Market Leader in Payment Infrastructure
The CPI Card Group investor presentation from March 2016 serves as a comprehensive overview of a company that has successfully captured a massive share of the North American payment card market. Rather than pitching a disruptive new idea, this deck pitches the strength of an established incumbent during a period of significant technological tailwinds—specifically the U.S. migration to EMV (chip) technology. The deck is heavily weighted toward market share statistics, recurring revenue models, and detailed financial performance, reflecting a company that is focused on operational excellence and capturing the upside of industry-wide hardware upgrades.
Slide 1: Title Slide
The title slide is minimalist, featuring the CPI Card Group logo and the date "March 2016." The imagery below the logo shows a collage of retail environments: a person shopping, a hand using a point-of-sale terminal, and a close-up of credit cards with EMV chips. This immediately establishes the company’s sector: the physical infrastructure of consumer payments.
Slide 2: CPI is a North American Leader in Payment Card Solutions
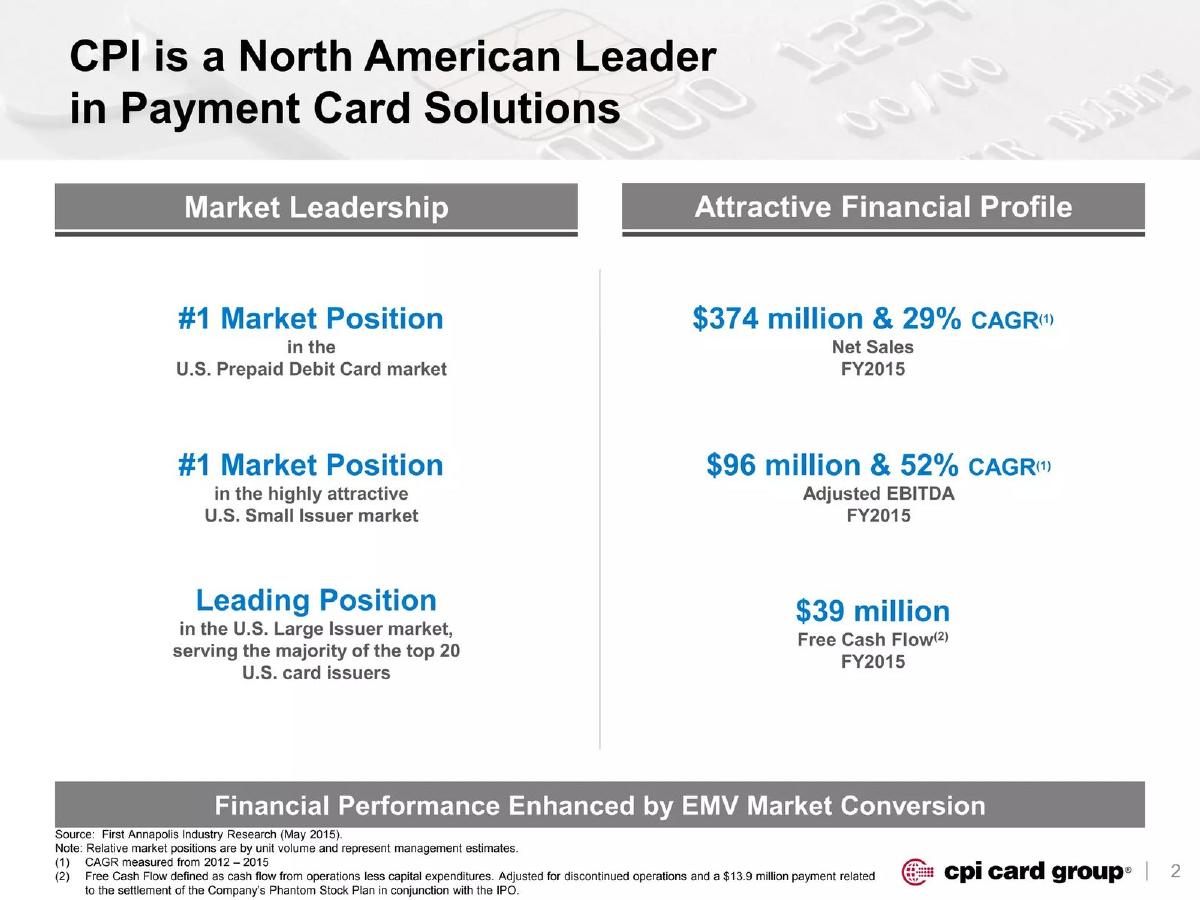
This is the 'highlights' slide, and it is dense with impressive figures. CPI positions itself as a market leader across three specific segments: #1 in U.S. Prepaid Debit Cards, #1 in the U.S. Small Issuer market, and a "Leading Position" in the U.S. Large Issuer market, serving the majority of the top 20 U.S. card issuers. The right side of the slide focuses on the "Attractive Financial Profile," citing $374 million in Net Sales for FY2015 with a 29% CAGR (2012-2015). It also notes $96 million in Adjusted EBITDA (52% CAGR) and $39 million in Free Cash Flow. This slide successfully validates the company’s scale and growth trajectory before diving into the mechanics of the business.
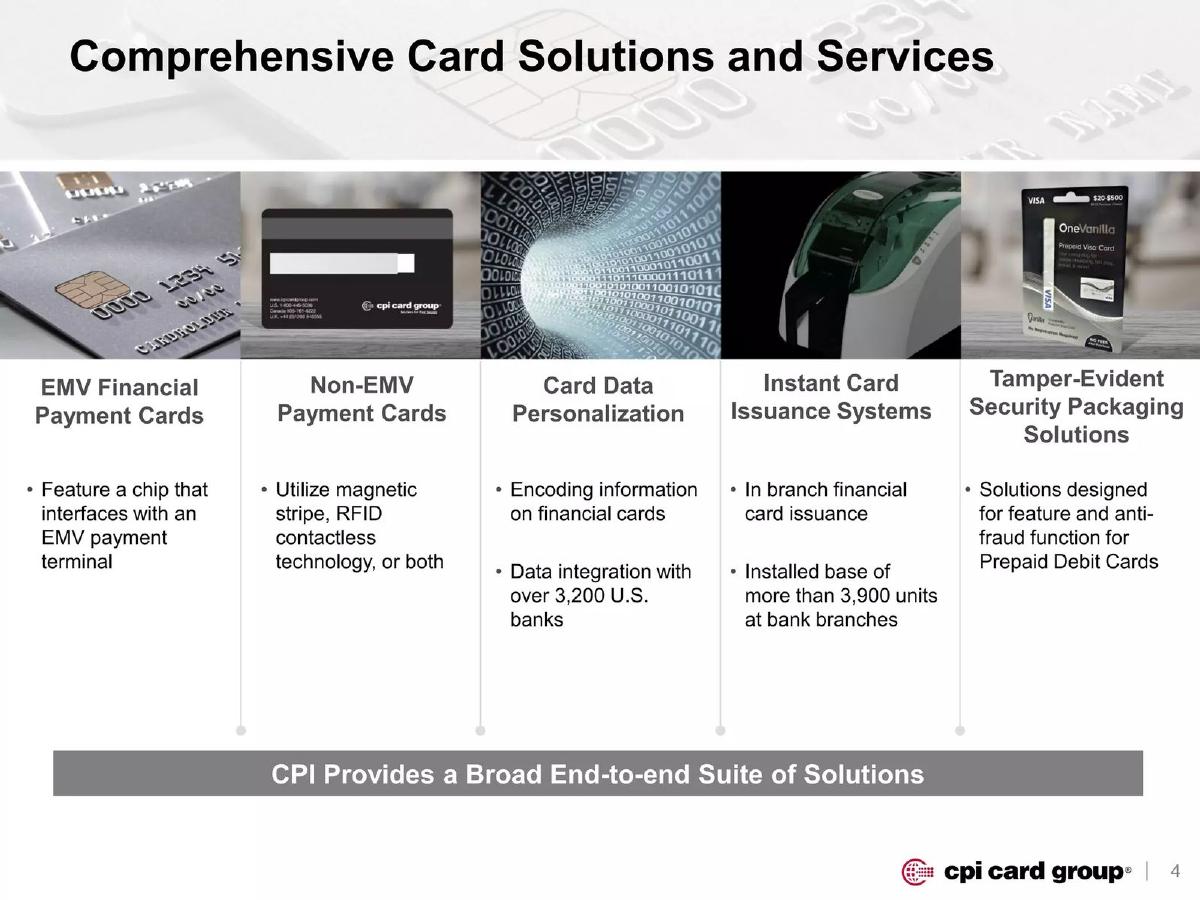
Slide 4: Comprehensive Card Solutions and Services
CPI uses this slide to demonstrate the breadth of its 'end-to-end' suite. The offerings are categorized into five pillars: EMV Financial Payment Cards, Non-EMV Payment Cards, Card Data Personalization, Instant Card Issuance Systems, and Tamper-Evident Security Packaging. Key metrics here include data integration with over 3,200 U.S. banks and an installed base of more than 3,900 instant issuance units at bank branches. This slide moves the company from being a 'card manufacturer' to a 'service and systems provider,' which typically commands higher valuation multiples.
Slide 6: Leading Industry Positions / Long-Term, Trusted Customer Relationships
This slide reinforces the competitive moat. It highlights over 20 years of experience and an average tenure of 10+ years with their top 5 customers. The most significant data point is at the bottom: CPI holds a "#1 Position in U.S. Financial Payment Card Market with ~35% Cards Produced." It also mentions the high barrier to entry provided by 7 high-security facilities, each certified by major payment card brands. For an investor, this slide answers the 'Why you?' question by pointing to scale, certification barriers, and customer stickiness.
Slide 8: Highly Visible and Recurring Demand
This is perhaps the most important slide for demonstrating business stability. CPI breaks down the 2014 Total Annual Card Issuance. A staggering 88% of demand is driven by the reissuance of existing cards: 53% from expiration, 19% from lost/stolen/fraud, and 16% from portfolio churn. Only 12% comes from new portfolio growth. This chart argues that even if the economy slows down or new bank accounts aren't opened, the vast majority of CPI's revenue is 'locked in' by the physical reality of cards wearing out or expiring. It frames the business as a recurring utility rather than a cyclical hardware play.
Slide 10: Dual-Interface Growth Beyond Initial EMV Conversion
Slide 10 addresses the future growth engine. It illustrates the transition from Magnetic Stripe (ASP of $0.20) to Contact EMV (ASP of $1.00) to Dual-Interface EMV (ASP of $2.00). By showing that Dual-Interface (contactless) cards are already growing globally in Canada, China, and the UK, CPI suggests that the U.S. market has a clear path to doubling its revenue per card again. This is a classic 'upsell' narrative based on technological evolution.
Slide 12: Continuous Innovation and Product Enhancement
This slide focuses on two specific value-adds: Tamper-Evident Packaging for the prepaid market and the Card@Once® Instant Issuance system. The latter is described as patented technology that allows branches to instantly issue personalized cards. The benefits listed—accelerated onboarding, increased usage, and brand differentiation—are aimed at the bank's pain points, showing that CPI understands its customers' business goals, not just their procurement needs.
Slide 14: Attractive Financial Profile (Summary)
This slide summarizes the financial thesis into three buckets: Strong Growth Profile (29% Sales CAGR), Significant Operating Leverage (26% Adjusted EBITDA margin), and Attractive Free Cash Flow Profile ($39.1 million in FY2015). It mentions a "strong deleveraging profile," suggesting the company has been paying down debt, which is a key metric for private equity or public market investors.
Slide 16: Quarterly Financial Highlights
This slide provides a granular look at revenue and EBITDA from Q1-2014 through Q4-2015. It shows a massive spike in year-over-year growth in early 2015 (82% revenue growth in Q1-15), which likely corresponds to the peak of the U.S. EMV migration. However, it also shows a cooling off to 6% growth by Q4-15. This transparency is necessary for sophisticated investors to understand the 'lumpiness' of a hardware migration cycle.
Slide 18: Non-GAAP Adjustments
The final slide in this selection is a detailed accounting table. It reconciles Net Income to EBITDA and Adjusted EBITDA. It accounts for foreign currency gains/losses, non-cash compensation, and investment banking fees. This level of detail is standard for a late-stage or public company and provides the 'proof' behind the high-level numbers presented earlier in the deck.
What CPI Card Group Does Well
The deck is exceptionally strong at demonstrating market dominance. By citing a 35% market share and #1 positions in multiple sub-sectors, CPI leaves no doubt about its leadership. The use of CAGR (Compound Annual Growth Rate) over a three-year period (2012-2015) provides a sense of sustained momentum rather than a one-time fluke. Furthermore, the breakdown of 'recurring' demand (Slide 8) is a masterclass in de-risking a business model for investors; it transforms a hardware company into something resembling a SaaS business in terms of predictability.
What is Missing from the Deck
As an investor presentation for a mature company, this deck omits several elements that a venture-stage startup would need. There is no 'Team' slide featuring the backgrounds of the executive leadership. There is no 'Problem' slide, as the problem (the need for secure payment cards) is assumed to be understood. Most notably, there is no 'Ask' or 'Use of Proceeds.' It is unclear if the company is looking for a specific investment, preparing for an IPO, or simply providing a quarterly update to existing shareholders. Additionally, while it mentions 'Intellectual Property,' it does not detail specific patents or the competitive landscape beyond CPI's own market share.
What Other Founders Can Copy
Founders should emulate the way CPI frames its revenue. If you have a business that relies on replacements or renewals, visualize that 'recurring' nature as CPI did on Slide 8. It is much more compelling to show that 88% of your business is inevitable than to claim you will grow 10x through new sales alone. Additionally, the 'ASP Ladder' on Slide 10 is a brilliant way to show how a company can grow revenue without needing to find new customers, simply by moving existing customers to higher-value products. Finally, the use of third-party validation (citing First Annapolis Industry Research) adds a layer of credibility that self-reported numbers lack.
Frequently asked questions
- What is CPI Card Group's primary market advantage?
- According to Slide 6, CPI Card Group holds a #1 position in the U.S. financial payment card market, producing approximately 35% of all cards. Their advantage is built on long-term relationships (averaging 10+ years with top 5 customers), deep integration with over 3,200 U.S. banks, and a network of 7 high-security certified facilities that are difficult for new competitors to replicate.
- How does the company view the sustainability of its revenue?
- The company characterizes its demand as 'highly visible and recurring.' Slide 8 shows that 88% of annual demand comes from reissuing existing cards due to expiration (53%), loss/theft/fraud (19%), and portfolio churn (16%). Only 12% of demand is attributed to new portfolio growth, suggesting a very stable baseline of business regardless of new customer acquisition.
- What is the financial impact of the EMV transition mentioned in the deck?
- The transition is a massive revenue multiplier. Slide 10 illustrates that traditional magnetic stripe cards have an Average Selling Price (ASP) of $0.20. Contact EMV cards jump to $1.00, and Dual-Interface EMV cards (contactless) reach $2.00. By moving the market toward higher-tech cards, CPI can increase its revenue per unit by 5x to 10x.
- What specific products does CPI Card Group offer beyond physical cards?
- Slide 4 and Slide 12 highlight 'Card@Once,' a patented instant issuance system that allows bank branches to print personalized debit cards on-site. They also provide card data personalization services, tamper-evident security packaging for prepaid cards, and integrated software solutions for over 3,200 U.S. banks.
- Is this a standard startup pitch deck?
- No. This is an investor presentation for a mature, likely publicly traded or late-stage private company. It lacks typical startup elements like a 'Problem' slide, a 'Team' slide with founder bios, or a specific 'Funding Ask.' Instead, it focuses on quarterly financial highlights (Slide 16) and Non-GAAP adjustments (Slide 18), which are standard for public equity reporting.