Campus Crest Communities presented a compelling case for the student housing REIT sector in late 2011, leveraging a massive 'Echo Boom' in college enrollments to justify their development pipeline. The deck effectively uses a 'then vs. now' visual strategy to position traditional on-campus dormitories as obsolete compared to their private, amenity-heavy apartment complexes. With a proven track record of ~$500 million in developed properties and a vertically integrated model, the company demonstrated steady occupancy (89% in 1H11) and RevPOB growth. However, the presentation relies heavily on…
Key takeaways
- College enrollment was projected to increase by approximately 1.5 million students between 2011 and 2019 (Slide 3).
- The company positions traditional dormitories as having 'extremely limited amenities' to highlight their own 'resort-style' offerings (Slides 6 and 9).
- Campus Crest operates a vertically integrated platform including property management, construction, and wholesale supply (Slide 12).
- The development track record at the time of the presentation totaled approximately $500 million in student housing properties (Slide 12).
- Weighted average occupancy reached 89% in the first half of 2011, up from 88% in CY07 (Slide 15).
- RevPOB (Revenue Per Occupied Bed) grew from $448 in CY07 to a peak of $488 in CY10 (Slide 15).
- Same-store Net Operating Income (NOI) grew 12.1% year-over-year, reaching $6.7 million in Q2 2011 (Slide 18).
- The company reiterated a full-year FFO per fully diluted share guidance of $0.72 to $0.78 (Slide 18).
Campus Crest: The 2011 Student Housing Playbook
The September 2011 investor presentation for Campus Crest Communities serves as a classic example of a REIT (Real Estate Investment Trust) growth story. At this time, the student housing sector was professionalizing, moving away from 'mom-and-pop' landlords toward institutional-grade, amenity-rich developments. The deck focuses on three core pillars: macro-economic tailwinds, product differentiation, and a scalable, vertically integrated execution model.
Slide 1: Title and Branding
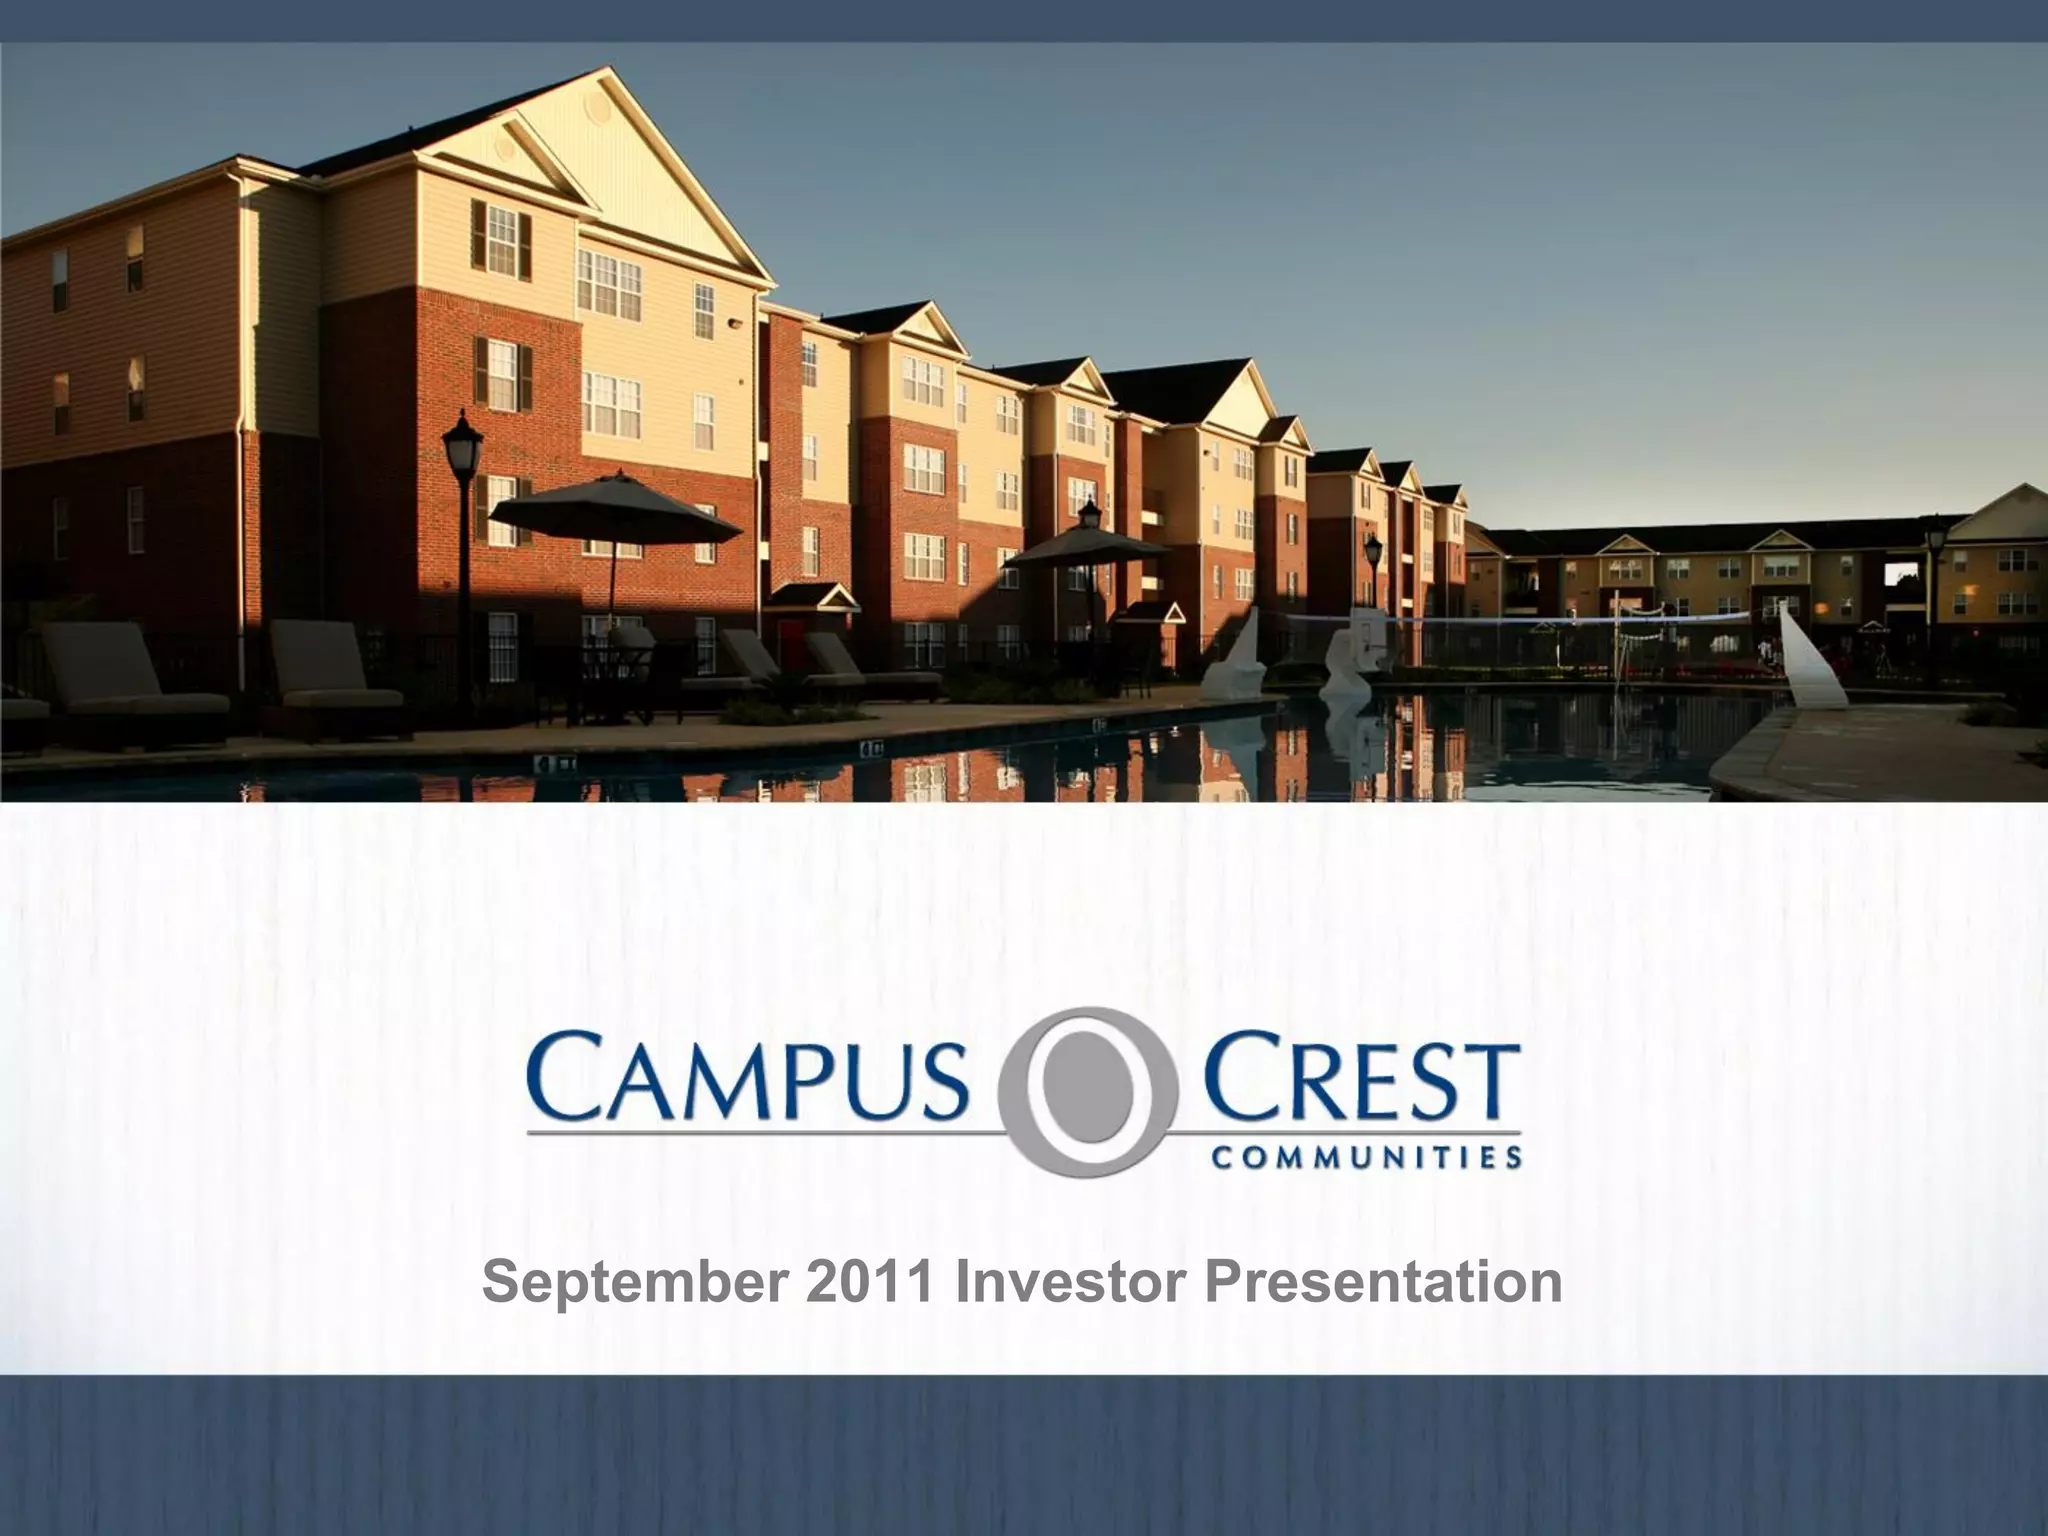
The cover slide establishes the visual identity of the brand. It features a high-resolution photograph of a modern, brick-faced apartment complex with a resort-style pool in the foreground. This immediately signals to the investor that the 'Campus Crest' product is not a traditional dormitory, but a lifestyle-oriented residential community. The date, September 2011, places this presentation in the post-recession recovery period where yield-seeking investors were looking for stable real estate assets.
Slide 3: Compelling Market Dynamics
This is the 'Why Now' slide. It uses a dual-column approach to contrast demand drivers against supply factors. On the demand side, the 'Echo Boom' (children of Baby Boomers) is cited as the primary engine for enrollment growth. A chart from the Dept. of Education shows a steep upward trajectory of college enrollments from 1950 through 2012, with a specific callout that enrollment is expected to increase by ~1.5 million students over the next 8 years. On the supply side, the deck highlights a critical weakness in the competition: 38 states cut educational budgets during the recession, meaning universities could not afford to build new housing. This creates a vacuum that private developers like Campus Crest intend to fill.
Slide 6: The Evolution of Student Housing – The Dormitory Era
Slide 6 is a 'villain' slide. It uses four unappealing photos of traditional on-campus housing: cramped rooms with thin mattresses, communal 'gang' showers, and institutional bathrooms. The text at the bottom hammers the point home, describing these alternatives as having 'shared rooms, communal bathroom facilities and extremely limited (if any) amenities and parking.' By visually defining the 'old way,' the company sets the stage for its own 'new way' of student living.
Slide 9: Our Properties are Attractive and Amenity-Rich
This slide serves as the direct counterpoint to Slide 6. It lists 'Apartment Features' that mirror luxury multi-family housing: private bedrooms with keyed locks, en suite bathrooms, full kitchens, and washers/dryers. The 'On-site Amenities' section lists resort-style pools, basketball/volleyball courts, and coffee bars. The photos show high-end clubhouses and fitness centers. The key takeaway here is 'bed-bath parity,' meaning every student gets their own bathroom—a significant upgrade from the communal facilities shown previously.
Slide 12: Identified Pipeline of Future Development Opportunities
To prove scalability, Slide 12 features a map of the United States dotted with 'Identified Development Sites' and '2011 Deliveries.' The company claims to have identified 200+ potential markets and is conducting due diligence on 80 sites. The right side of the slide explains how they will execute this: a 'vertically integrated, highly scalable operating platform.' By controlling everything from wholesale supply to construction, they claim to reduce costs and shorten development periods. They cite a 'proven track record' of ~$500 million in developed properties to date.
Slide 15: Increasing Occupancy and RevPOB
This is the core performance slide. It uses two bar charts to show historical trends from CY07 to 1H11. The first chart shows Weighted Average Occupancy, which remained resilient through the recession, moving from 88% in 2007 to 89% in the first half of 2011. The second chart tracks RevPOB (Revenue Per Occupied Bed), showing a steady climb from $448 to a peak of $488 in 2010, before a slight dip to $477 in 1H11. The slide notes that the portfolio grew from 10 to 27 properties in this timeframe, proving that the company could maintain high occupancy even while rapidly expanding its footprint.
Slide 18: Q2 2011 Performance
The final slide in this set provides a snapshot of recent financial health. The standout metric is a 12.1% increase in same-store Net Operating Income (NOI), growing from $6.0 million to $6.7 million year-over-year. It also highlights 'Pre-leasing' for the 2011/2012 academic year, noting the operating portfolio was 87.0% leased as of August 1, 2011. The slide concludes by reiterating FFO (Funds From Operations) guidance of $0.72 to $0.78 per share, providing investors with a clear expectation for year-end results.
What Campus Crest Does Well
The deck is exceptionally strong at defining a clear 'gap' in the market. By using the 'Dormitory Era' slide (Slide 6) to create a visceral sense of the low quality of existing supply, they make the 'Amenity-Rich' solution (Slide 9) feel like an inevitability rather than a luxury. This 'Problem/Solution' framing is highly effective for real estate investors who need to see a clear reason why tenants would choose a new building over an established (but inferior) one.
Furthermore, the focus on vertical integration (Slide 12) addresses a common investor concern in real estate: margin leakage. By claiming to handle construction and wholesale supply in-house, Campus Crest positions itself as a high-efficiency 'factory' for student housing, rather than just a passive owner of assets. This suggests that their growth is not just about buying land, but about an operational advantage that competitors might lack.
What is Missing from the Deck
While the deck provides a strong macro and operational overview, several key pieces of information are missing from the provided slides. First, there is no detailed 'Team' slide in this selection. For a company claiming a 'proven track record' of $500 million in development, seeing the specific backgrounds of the executives (like Ted Rollins) and their experience in previous cycles would be vital. Second, the deck lacks a specific 'Use of Funds' or 'Capital Structure' slide. While it mentions a pipeline of 80 sites, it does not specify how much capital is required to break ground on these projects or what the debt-to-equity ratio looks like for the current portfolio.
Additionally, the deck does not address the 'downside' of the Echo Boom. While enrollment was growing in 2011, the deck does not discuss the potential impact of rising tuition costs or the shift toward online learning, which were already emerging as long-term risks to physical campus housing. Finally, there is no mention of the competitive landscape beyond 'obsolete' dorms. Other student housing REITs existed at the time, and the deck does not explain why Campus Crest's specific 'prototypical roll-out' is superior to other institutional developers.
Lessons for Founders
Founders in the real estate or physical infrastructure space should pay close attention to Slide 15. The use of 'RevPOB' (Revenue Per Occupied Bed) is a masterclass in using industry-specific metrics to tell a story. If Campus Crest had simply used 'Total Revenue,' the growth might have looked like it was solely due to adding more buildings. By showing that the revenue per bed was also increasing, they proved they had pricing power and the ability to upsell services to their residents.
Another lesson is the power of the 'Pipeline' map (Slide 12). For a growth-stage company, showing a map covered in dots is a psychological shortcut for 'momentum.' It transforms a theoretical business plan into a tangible, national footprint. However, founders should ensure they can back up these 'identified sites' with the vertical integration story Campus Crest used, otherwise, the map just looks like a wish list rather than a strategy.
Final Summary
The Campus Crest deck is a disciplined, metric-heavy presentation that successfully bridges the gap between macro demographic trends and micro-level property performance. It uses visual storytelling to make traditional dorms look like a relic of the past, effectively positioning the company's modern apartments as the only logical choice for the modern student. While it lacks some granular detail on capital requirements and competitive positioning, it provides a robust framework for how a REIT can communicate scale and operational efficiency to the market.
Frequently asked questions
- What is RevPOB and why does Campus Crest use it?
- RevPOB stands for Revenue Per Occupied Bed. As defined on Slide 15, it includes both student housing leasing and student housing services revenue. For a student housing REIT, this is a more accurate metric than standard apartment 'rent per unit' because students typically sign individual leases for a single bed within a shared apartment.
- How does the company justify the need for new student housing?
- Slide 3 points to a 'Supply-Demand' imbalance. Demand is driven by the 'Echo Boom' and increasing college enrollment rates. Supply is constrained because 38 states cut educational budgets during the recession, leading to a lack of investment in on-campus housing and the obsolescence of existing stock.
- What does 'vertically integrated' mean in this context?
- According to Slide 12, Campus Crest manages the entire lifecycle of a property. This includes site selection, development and construction, wholesale supply, and ongoing property and asset management. They claim this prototypical roll-out reduces costs and shortens the development period.
- What was the company's portfolio size at the time of this deck?
- Slide 15 shows the portfolio growth. By the first half of 2011 (1H11), the company had a total of 27 properties. This was a significant increase from the 10 properties they held in CY07, representing a rapid scaling of their 'prototypical' model.
- What financial guidance did the company provide for 2011?
- On Slide 18, the company reiterated its Funds From Operations (FFO) guidance. They projected a range of $0.72 to $0.78 per fully diluted share. They also reported a Q2 2011 FFO of $0.17 per diluted share, showing they were on track to meet that annual guidance.