Koffie’s Series A deck is a lean, 14-slide presentation that successfully bridges the gap between traditional insurance mechanics and modern data science. By identifying three specific pain points in the trucking industry—expensive premiums, insurer unprofitability, and slow manual quoting—Koffie positions its proprietary 'kScore' and API-driven infrastructure as the necessary evolution for the sector. The deck emphasizes a transition from a managing general agent (MGA) to a full-stack carrier, a move that signals long-term margin expansion. While the provided slides redact specific financial…
Key takeaways
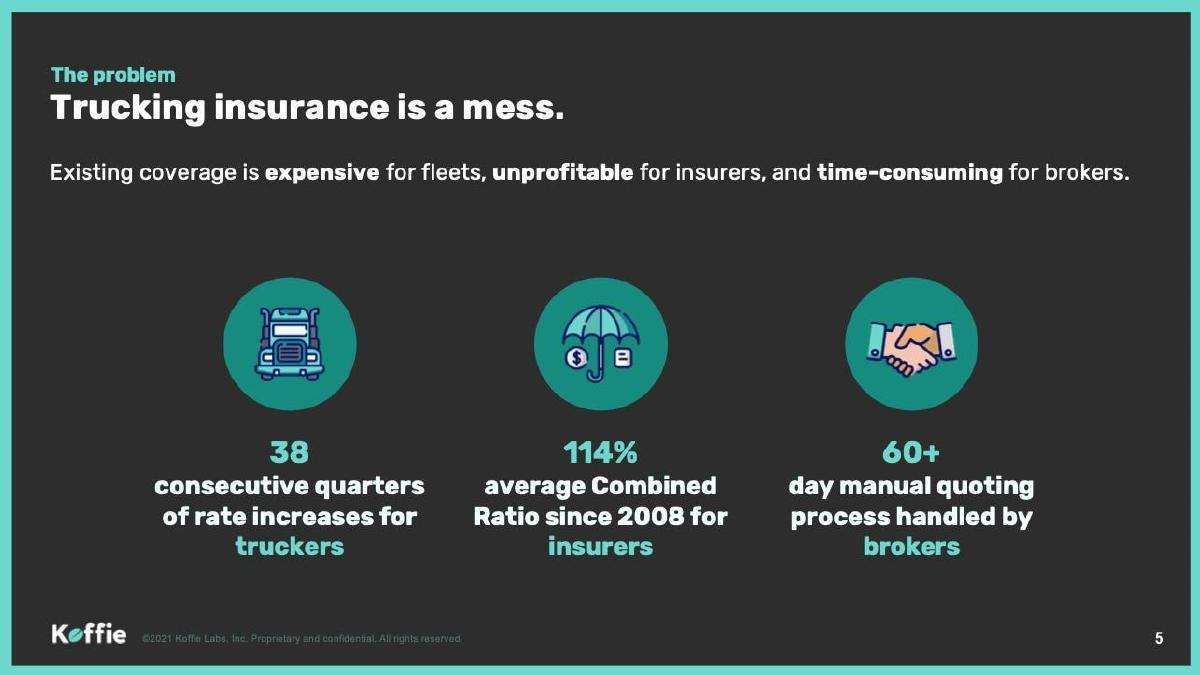
- The deck identifies a critical industry failure: an average 114% Combined Ratio for insurers since 2008, indicating systemic unprofitability (Slide 5).
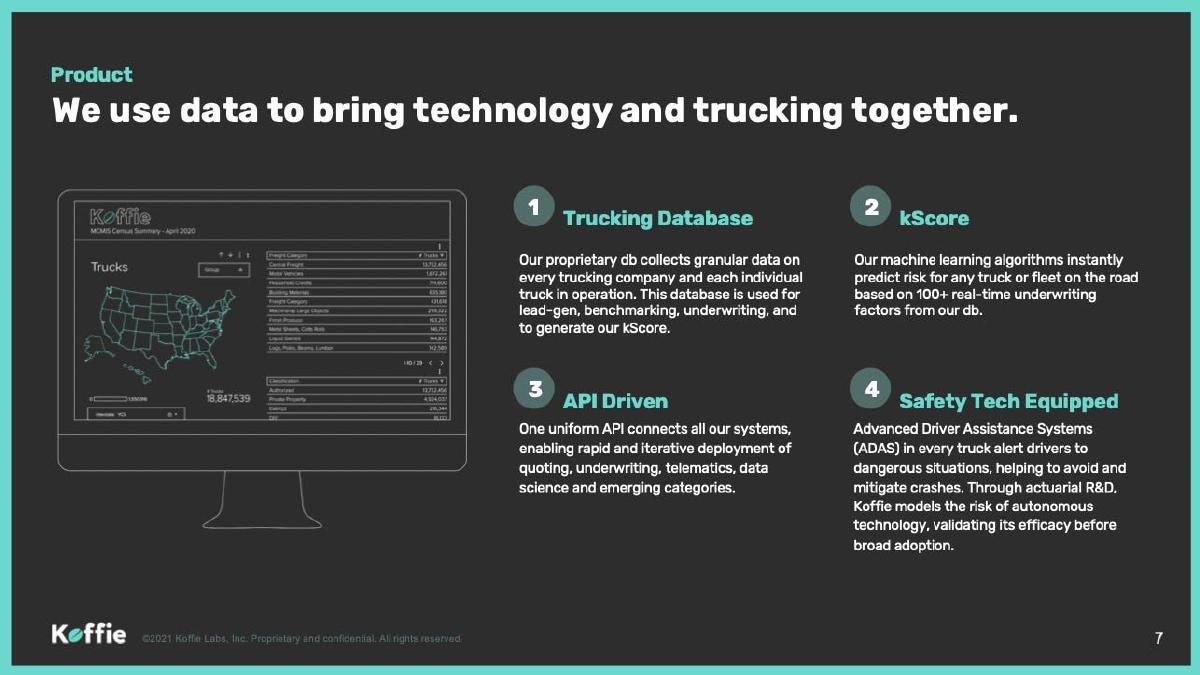
- Koffie utilizes a proprietary 'kScore' based on 100+ real-time underwriting factors to predict risk instantly (Slide 7).
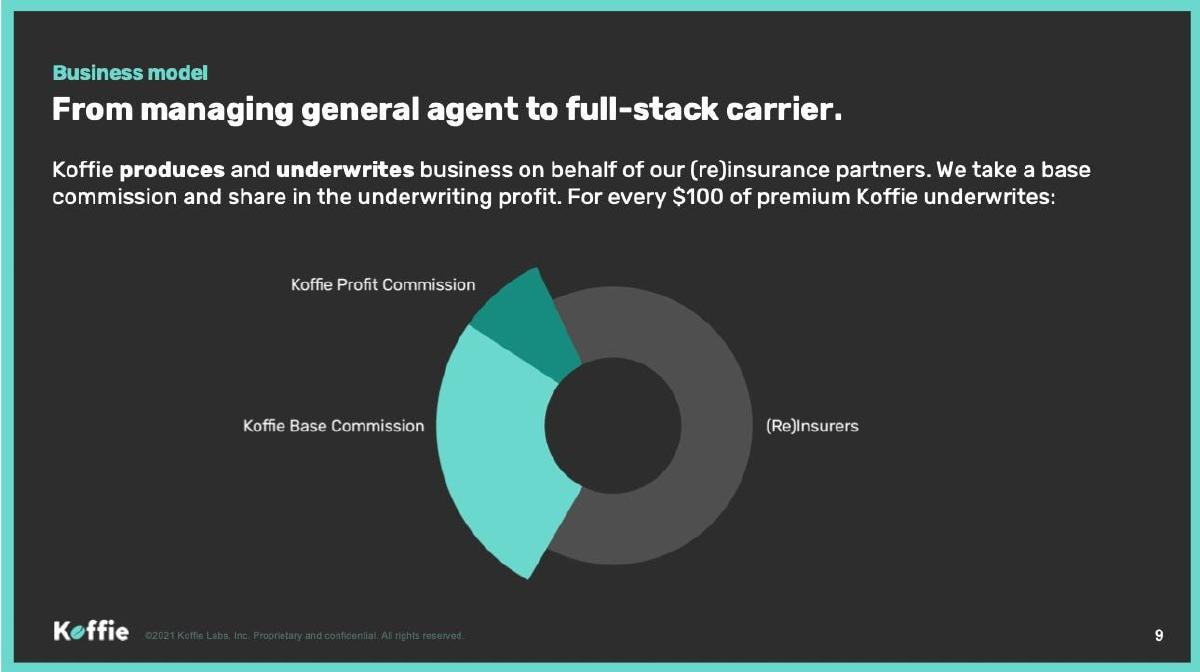
- The business model relies on a dual revenue stream: a base commission and a share in underwriting profits (Slide 9).
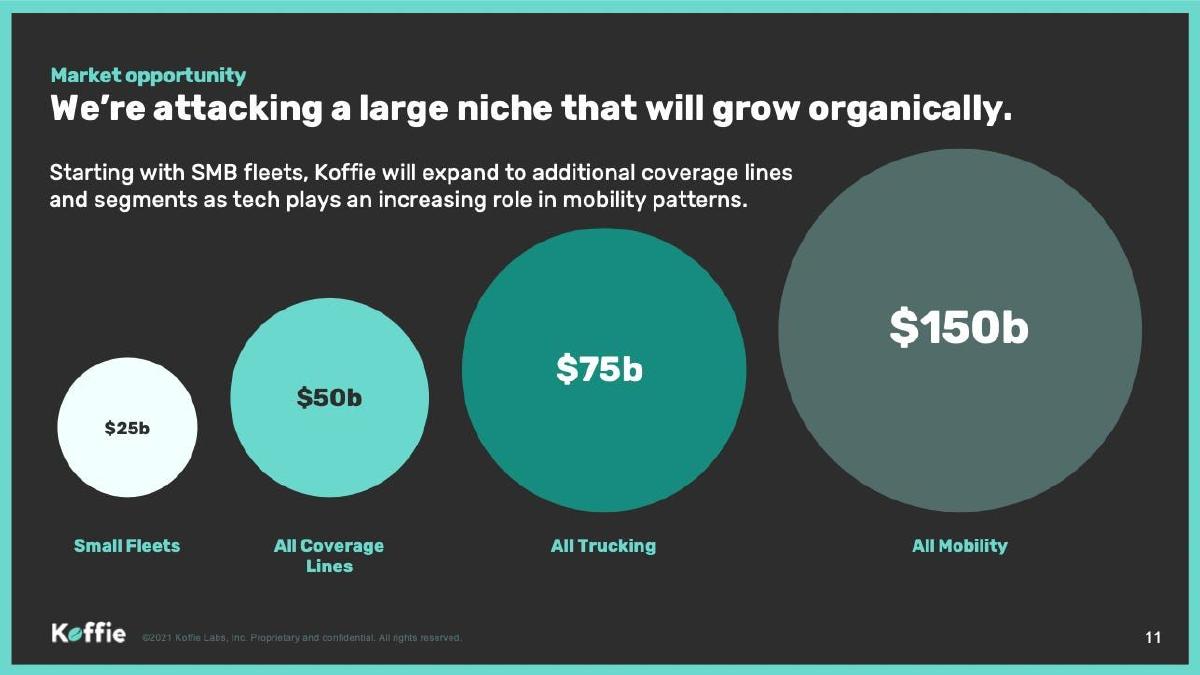
- Market sizing is presented as a concentric expansion, starting at a $25B small fleet niche and scaling to a $150B mobility market (Slide 11).
- The product architecture is built on a uniform API to enable rapid deployment of quoting and telematics (Slide 7).
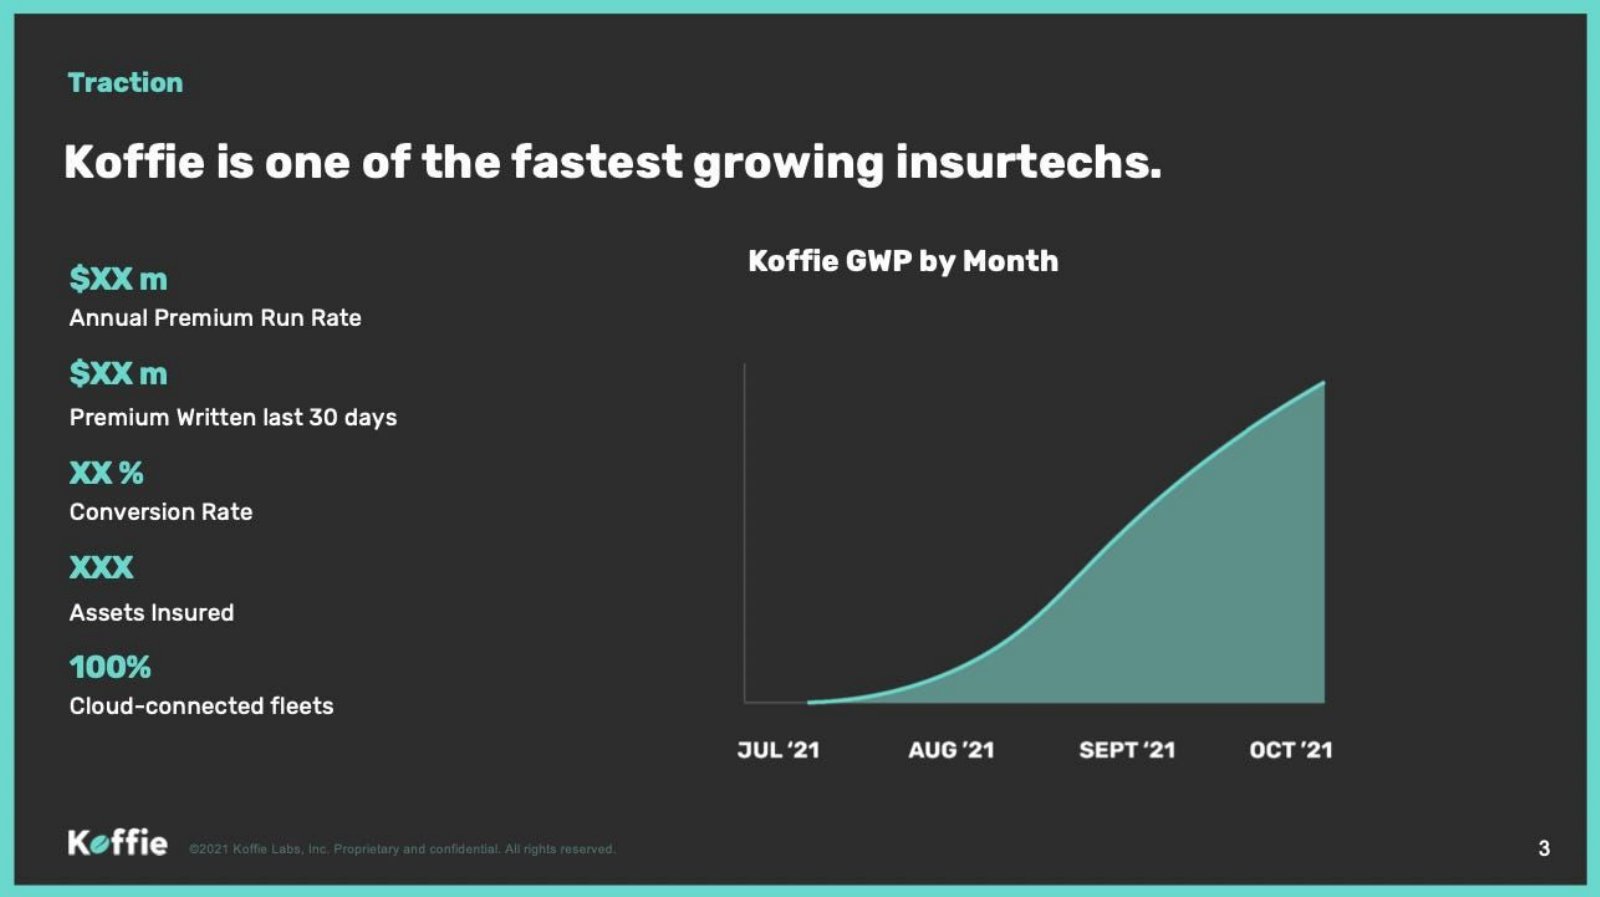
- Traction is visualized through Gross Written Premium (GWP) growth from July '21 to October '21, though specific dollar amounts are redacted in this version (Slide 3).
- The company mandates 100% cloud-connectivity for its fleets to ensure data integrity for underwriting (Slide 3).
- Koffie positions itself as a safety-tech company, using Advanced Driver Assistance Systems (ADAS) to mitigate crashes and model autonomous risk (Slide 7).
Introduction: The Data-Driven Insurtech Play
Koffie’s Series A deck is a focused look at how alternative data can disrupt a legacy financial sector. As reported by Business Insider, the company raised $11M in 2024 to scale its operations in North America. The deck consists of 14 slides, of which 7 are analyzed here. The narrative is built on the premise that trucking insurance is fundamentally broken for all stakeholders: the fleets, the insurers, and the brokers. By positioning themselves as a technology-first underwriter, Koffie attempts to solve the unprofitability that has plagued the industry for over a decade.
Slide 1 & 2: The Visual Identity
The opening slides establish a professional, industrial tone. Using high-quality, black-and-white photography of heavy-duty trucks, the deck immediately signals its sector focus. The branding is clean, utilizing a teal and dark-grey color palette that feels modern yet grounded. Slide 1 explicitly labels this as a "Series A Investor Presentation," setting clear expectations for the stage of the business and the level of maturity required in the following data.
Slide 3: Traction and Growth Velocity
Slide 3, titled "Traction," makes a bold claim: "Koffie is one of the fastest growing insurtechs." The slide uses a Gross Written Premium (GWP) by Month chart covering July '21 through October '21. While the specific dollar amounts are redacted as "$XX m" and the conversion rate as "XX %," the visual representation shows an exponential upward curve. Key metrics highlighted include:
Annual Premium Run Rate · Premium Written last 30 days · Conversion Rate · Assets Insured · 100% Cloud-connected fleets
The inclusion of the "100% Cloud-connected fleets" metric is particularly important for an insurtech company. It proves that their data pipeline is active and that they aren't just a traditional broker with a website, but a firm that requires hardware/software integration to function.
Slide 5: Defining the Industry 'Mess'
The "Problem" slide is one of the strongest in the deck because it uses hard industry data to justify Koffie's existence. It breaks the problem down into three quantifiable pillars:
For Fleets: 38 consecutive quarters of rate increases, making insurance a massive cost center for truckers. · For Insurers: A 114% average Combined Ratio since 2008. In insurance terms, a ratio over 100% means the insurer is paying out more in claims and expenses than it is taking in via premiums. This highlights a systemic failure in underwriting. · For Brokers: A 60+ day manual quoting process, which represents a massive operational inefficiency.
By citing these specific figures, Koffie demonstrates a deep understanding of the market's pain points, moving beyond vague claims of "disruption."
Slide 7: The Product and the 'kScore'
Slide 7 explains how Koffie uses data to bridge the gap between technology and trucking. The product is described through four components:
Trucking Database: A proprietary database that collects granular data on every trucking company and individual truck for lead generation and underwriting. · kScore: The core intellectual property. This machine learning algorithm predicts risk based on 100+ real-time underwriting factors. · API Driven: A uniform API that connects quoting, underwriting, and telematics, allowing for rapid deployment. · Safety Tech Equipped: A focus on Advanced Driver Assistance Systems (ADAS) to mitigate crashes.
The mention of ADAS and autonomous technology modeling is a strategic inclusion. It suggests that Koffie is not just insuring today's trucks but is building the infrastructure to insure the self-driving fleets of the future.
Slide 9: The Business Model and Margin Expansion
Slide 9 clarifies how Koffie makes money and where it is going. The headline, "From managing general agent to full-stack carrier," is a common but difficult evolution for insurtechs. Currently, they operate as an MGA, taking a "Base Commission" and a "Profit Commission" from every $100 of premium underwritten. The remaining portion goes to the (re)insurers who carry the actual risk on their balance sheets. By signaling a move toward becoming a full-stack carrier, Koffie is telling investors that they plan to eventually capture the entire pie, significantly increasing their potential margins if their 'kScore' underwriting proves accurate.
Slide 11: The Concentric Market Opportunity
The "Market Opportunity" slide uses a classic concentric circle visualization to show the path to a $150B valuation. It starts with a "Small Fleets" niche at $25B, expands to "All Coverage Lines" at $50B, then "All Trucking" at $75B, and finally "All Mobility" at $150B. This slide is designed to answer the "Is this big enough?" question. It shows that while Koffie is starting small to perfect its underwriting model, the technology is horizontally scalable across all forms of mobility.
Slide 13: The Mission Statement
The final slide in the analyzed set moves from data to emotion. It features a photo of a truck driver and a fleet manager with the text: "We're empowering the 99% of truckers toward a safe and profitable future." This reinforces the idea that Koffie is a partner to the small business owner, not just another predatory insurance company. It ties the technological advancements (safety) back to the economic reality (profitability) of their target customer.
What Works in the Koffie Deck
The deck excels at identifying a specific, high-pain problem and offering a technical solution. The use of the 114% Combined Ratio metric (Slide 5) is a masterstroke; it immediately tells an investor that the current market leaders are incompetent at pricing risk, which creates a massive opening for a data-driven competitor. The clear distinction between the MGA model and the full-stack carrier model (Slide 9) also shows a sophisticated understanding of insurance unit economics. Furthermore, the product slide (Slide 7) does not just list features; it explains the "kScore" as a proprietary engine, which is the kind of "moat" venture capitalists look for in fintech.
What is Missing from the Koffie Deck
Based on the 7 slides provided, there are several critical omissions that a founder should be aware of. First, there is no Team Slide . In a Series A round, the pedigree of the founders—specifically their experience in both insurance regulation and data science—is paramount. Second, there is no Competition Slide . The insurtech space is crowded with players like CloudTrucks or Reliance Partners, and failing to address how Koffie wins against them is a gap. Third, the Ask Slide is missing. While we know they raised $11M, a pitch deck should explicitly state how much is being raised and, more importantly, what milestones that capital will achieve (e.g., "Hire 20 engineers," "Expand to 10 more states," "Obtain carrier license"). Finally, the Unit Economics are thin; while we see the commission structure, we don't see the Customer Acquisition Cost (CAC) or the Lifetime Value (LTV) of a fleet.
What Founders Should Copy
Founders should emulate the way Koffie visualizes their market expansion (Slide 11). Instead of just claiming a $150B TAM, they show the logical steps to get there, starting with a manageable $25B niche. This makes the large number feel earned rather than invented. Additionally, the "Problem" slide (Slide 5) is a perfect template for any B2B startup. It identifies three distinct stakeholders and gives a specific, data-backed reason why the current status quo is failing each of them. This "triangulation of pain" makes the need for a new solution feel inevitable. Lastly, the use of a proprietary metric like "kScore" (Slide 7) is a great way to brand your technology; it turns a generic "algorithm" into a tangible asset that investors can associate with the company's value.
Frequently asked questions
- What is the core problem Koffie is solving?
- Koffie addresses the 'mess' of trucking insurance, which it defines through three metrics on Slide 5: 38 consecutive quarters of rate increases for truckers, a 114% average combined ratio for insurers (meaning they lose money on underwriting), and a manual quoting process that takes over 60 days for brokers to complete.
- How does Koffie differentiate its technology from traditional insurers?
- According to Slide 7, Koffie uses a proprietary trucking database and 'kScore' algorithms. Unlike traditional insurers that rely on historical actuarial tables, Koffie uses 100+ real-time underwriting factors and requires 100% cloud-connectivity for its fleets to provide instant, data-driven risk assessment.
- What is Koffie's long-term business model strategy?
- Slide 9 outlines a transition from a managing general agent (MGA) to a full-stack carrier. Currently, they produce and underwrite business for (re)insurance partners, taking a base commission and a profit commission. Becoming a full-stack carrier would allow them to retain more of the underwriting profit.
- How large is the market opportunity for Koffie?
- Slide 11 breaks the market into four stages: Small Fleets ($25B), All Coverage Lines ($50B), All Trucking ($75B), and All Mobility ($150B). This suggests that while they are starting in a specific niche, their technology is applicable to the broader transportation and mobility sector.
- Does the deck include financial projections or a team overview?
- The provided 7-slide sample does not include a team slide or multi-year financial projections. It focuses heavily on the market problem, product solution, and the mechanics of their business model. The traction slide (Slide 3) shows a growth curve but redacts the specific GWP and conversion rate figures.