Innovamat’s Series A deck is a masterclass in visual storytelling for complex EdTech ecosystems. By focusing on a 'Product Universe' rather than a simple feature list, the company demonstrates how it integrates into every facet of the classroom, from lesson plans to student practice. The deck relies heavily on high-engagement metrics, reporting a 92.9% WAU/MAU ratio for teachers and a 79.7% ratio for students as of October 2021. While the deck lacks a traditional 'Team' slide with individual bios, it provides a unique 'Organization Insides' slide that breaks down headcount by function, showin…
Key takeaways
- The deck defines the company as a 'Global K-12 content provider' rather than just a software tool on Slide 2.
- Innovamat uses a 'Product Universe' diagram on Slide 3 to show a 5-step circular workflow: Find, Prepare, Teach, Practice, and Analyze.
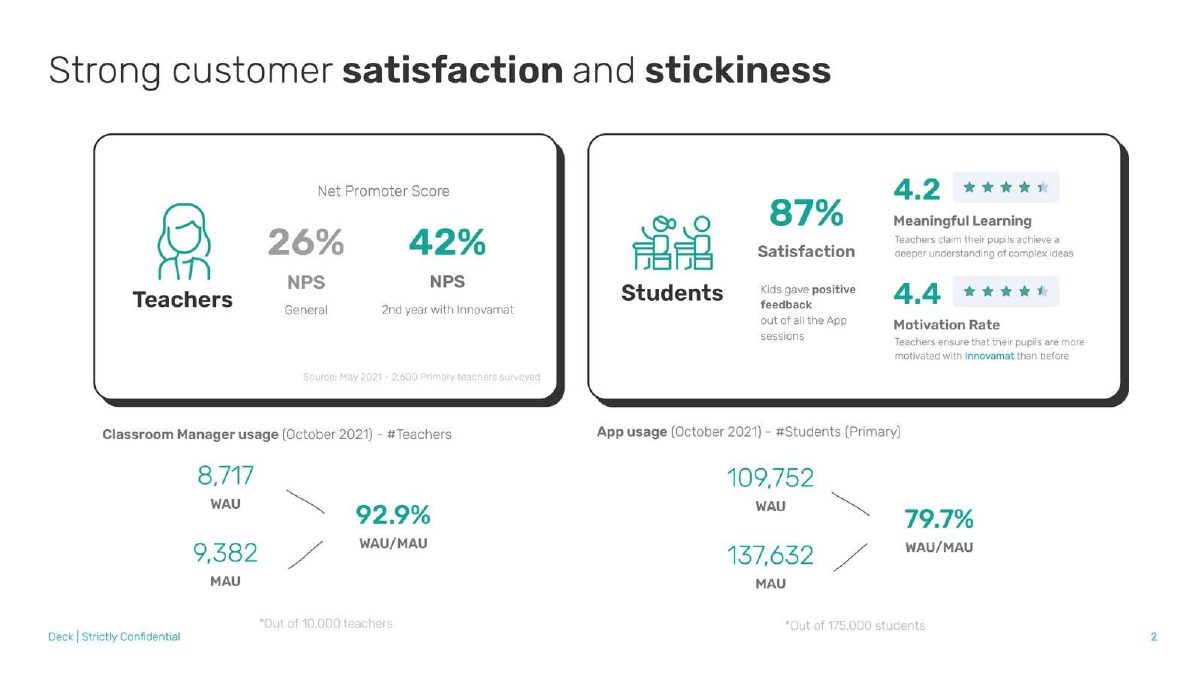
- Teacher engagement is exceptionally high, with 8,717 Weekly Active Users (WAU) out of 9,382 Monthly Active Users (MAU) as shown on Slide 4.
- Student stickiness is demonstrated by 109,752 WAU against 137,632 MAU, representing a 79.7% engagement rate on Slide 4.
- The company reports a 26% general NPS for teachers, which rises to 42% for those in their second year of usage on Slide 4.
- Headcount distribution is transparently shared on Slide 5, showing 200+ employees with a 36% focus on Revenue-generating roles.
- The market segmentation on Slide 7 clearly positions Innovamat in the 'Learning Services' vertical of the K-12 sector.
- The deck omits a specific 'Ask' slide and individual founder biographies, focusing instead on organizational metrics and product breadth.
Innovamat Pitch Deck Teardown: Scaling the Mathematics Classroom
Innovamat’s 13-slide deck, used during their 2024 Series A round where they secured $21M, is a distinct departure from the typical 'problem-solution' template. As a European EdTech firm focusing on K-8 math, the company uses this presentation to prove that they aren't just a software app, but a fundamental infrastructure for the modern classroom. The deck is dated 2021, suggesting these materials were part of the long-term narrative leading into their significant 2024 raise.
Slide 1-2: The Vision and Positioning
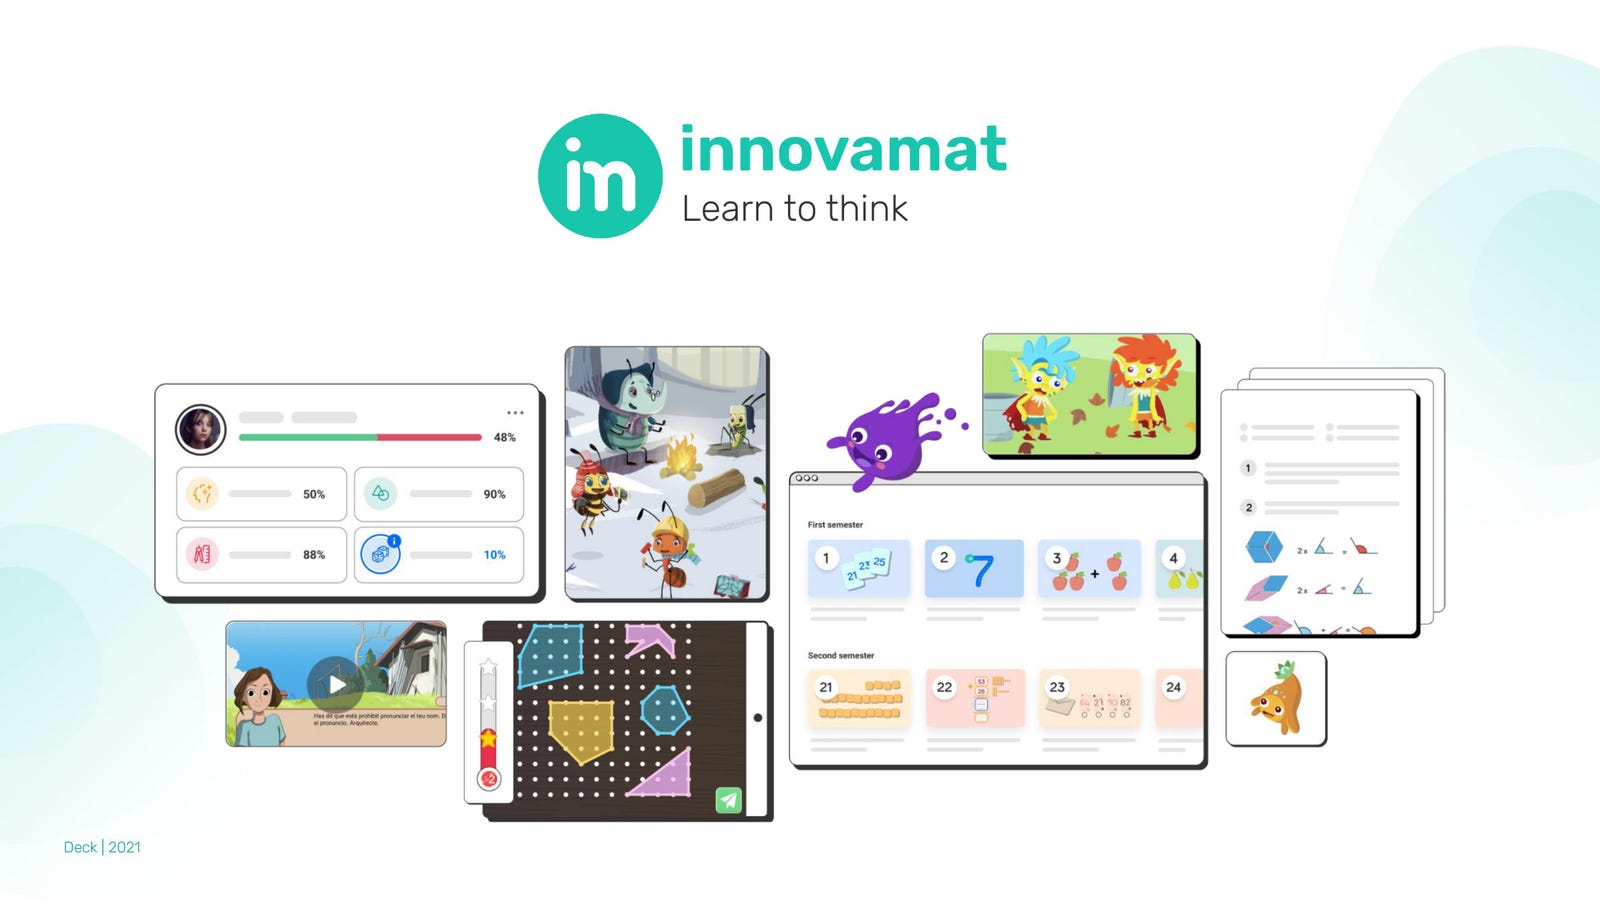
The deck opens with a clean title slide featuring the Innovamat logo and the tagline 'Learn to think.' Slide 2 immediately establishes the philosophical and commercial stakes. It asks, 'Do we educate to become mediocre robots or great humans?' This framing elevates the product from a utility to a mission-driven necessity. The core positioning is explicitly stated in a boxed callout: 'Innovamat, the Global K-12 content provider for today’s world.' By using the term 'content provider' rather than 'EdTech app,' they signal a broader moat involving proprietary curriculum and pedagogical intellectual property.
Slide 3: The Product Universe
Slide 3 is perhaps the most important slide in the deck for understanding the business model. Titled 'Everything teachers need,' it visualizes the 'Product Universe.' The graphic is a circular workflow consisting of five stages: 1. Find Lesson, 2. Prepare Lesson, 3. Teach Lesson, 4. Student Practice, and 5. Analyze. Surrounding this circle are screenshots and icons representing curriculum-aligned itineraries, lesson plans, professional development videos, interactive activities, workbooks, and progress reports. This slide successfully argues that Innovamat is a 'sticky' product because it replaces multiple disparate tools with a single ecosystem. It addresses the teacher's entire workday, not just the 20 minutes a student spends on a tablet.
Slide 4: Engagement and Satisfaction Metrics
Slide 4, 'Strong customer satisfaction and stickiness,' provides the hard data required for a Series A. The metrics are divided between Teachers and Students. For teachers, the deck reports a 26% general NPS, which notably jumps to 42% for those in their second year. This 'second-year jump' is a powerful indicator of long-term retention and product mastery. The usage data from October 2021 is even more compelling: 8,717 Weekly Active Users (WAU) out of 9,382 Monthly Active Users (MAU). This 92.9% WAU/MAU ratio is exceptionally high for software, suggesting daily reliance. On the student side, the deck reports 109,752 WAU out of 137,632 MAU (79.7%), alongside an 87% satisfaction rate and a 4.4/5 motivation rate as reported by teachers.
Slide 5: Organization Insides
Instead of a traditional team slide with headshots, Slide 5 focuses on 'Organization Insides.' It lists 200+ employees with an average age of 30 and an internal NPS of 60. The slide includes a pie chart breaking down the headcount: 36% Revenue, 26% Content & Learning, 23.5% Tech & Product, 10.5% Corporate, and 4% C-Level. This distribution tells a story of a company that is heavily invested in its sales engine (Revenue) and its pedagogical core (Content), rather than just being a lean tech shop. The mention of 40% female staff and a 'high talent density' emphasizes the corporate culture as a scalable asset.
Slide 6-7: Market Segmentation
Slide 6 is a simple transition slide labeled 'Appendix,' though Slide 7 follows it with 'We focus on learning in K-12.' Slide 7 provides a market segmentation map. It places Innovamat squarely in the 'Learning Services' category, which includes curricular content, supplemental materials, and digital platforms. By mapping out adjacent categories like 'School Infrastructure' and 'School Management,' Innovamat shows investors exactly where they sit in the budget and who they are—and are not—competing with. The focus is strictly on the K-12 Primary and Secondary segments, avoiding the distractions of Higher Ed or Corporate Learning.
What Innovamat Does Well
Ecosystem Mapping: The 'Product Universe' on Slide 3 is a masterclass in showing breadth. Investors often fear that EdTech tools are 'features, not companies.' By showing that they provide physical workbooks, teacher training, and data analytics alongside the software, Innovamat proves they are a full-stack curriculum replacement.
Retention Narrative: Highlighting the increase in NPS from Year 1 to Year 2 (Slide 4) is a brilliant way to show that the product gets better as the user becomes more familiar with it. This directly counters the 'churn' concerns often associated with classroom tools.
Operational Transparency: Sharing the exact headcount distribution (Slide 5) gives investors a clear view of how the company spends its capital. Seeing that 26% of the staff is dedicated to 'Content & Learning' validates their claim of being a 'content provider' rather than just a software platform.
What is Missing from the Innovamat Deck
The Ask: The slides provided do not include a specific funding request, valuation, or use of proceeds. While the publisher reports a $21M raise, the deck itself leaves the financial requirements to the imagination or a separate document.
Financial Projections: There is no mention of ARR (Annual Recurring Revenue), CAC (Customer Acquisition Cost), or LTV (Lifetime Value). While the usage metrics are strong, the economic engine of the business is not detailed in these slides.
Individual Pedigree: The lack of a traditional team slide with founder bios is unusual for a Series A. While the 'Organization Insides' slide shows scale, it doesn't tell the investor who is steering the ship or what their specific expertise in mathematics or education is.
Founder Takeaways
Visualize the Workflow: If your product has multiple touchpoints, don't just list features. Create a 'Universe' or 'Journey' map like Slide 3 to show how you integrate into the user's daily life. · Use WAU/MAU to Prove Stickiness: In EdTech and SaaS, Monthly Active Users can be a vanity metric. Showing a high Weekly Active User ratio (as seen on Slide 4) proves that your product is a habit, not a novelty. · Segment Your Market: Use a grid or map like Slide 7 to show exactly which 'bucket' of the industry you occupy. This helps investors understand your true competitors and your total addressable market (TAM). · Quantify Culture: If you have a large team, use a headcount distribution chart. It shows organizational maturity and strategic priorities more effectively than a list of names.
Frequently asked questions
- What is the core product Innovamat is selling?
- Innovamat sells a comprehensive K-12 math curriculum that includes digital platforms, physical workbooks, lesson plans, and professional development for teachers. As shown on Slide 3, they position themselves as a 'Product Universe' that covers the entire teaching cycle from preparation to student practice and data analysis.
- How does Innovamat demonstrate product-market fit?
- They use high-frequency usage data. Slide 4 shows a WAU/MAU ratio of 92.9% for teachers and 79.7% for students. These figures suggest that once a school adopts the platform, it becomes a daily or weekly necessity rather than a supplemental tool used occasionally.
- Why is the headcount distribution slide important?
- Slide 5 shows that 26% of the 200+ employees are in 'Content & Learning.' For an EdTech company, this proves they are building proprietary pedagogical value rather than just a software wrapper. The 36% allocation to 'Revenue' indicates a strong focus on sales and scaling.
- How does the deck handle competition?
- The provided slides do not include a standard competitive matrix. Instead, Slide 7 uses a market segmentation map to show they occupy the 'Learning Services' niche (Curricular content, supplemental materials, digital platforms) within the broader K-12 market, effectively distancing themselves from 'School Infrastructure' or 'Management' tools.
- What is missing from this Series A deck?
- The deck lacks a clear financial projection slide, a specific funding 'Ask' (though the publisher reports $21M raised), and a traditional team slide with names and backgrounds. It relies on the strength of its current scale (200+ employees) and engagement metrics to carry the narrative.