The Cornerstone OnDemand (CSOD) Q1 2017 Corporate Overview is a high-level investor deck designed to reinforce the company's position as a stable, organically-grown leader in the Human Capital Management (HCM) space. Rather than focusing on disruptive new technology, the deck leans heavily on social proof, showcasing a 'who's who' of global enterprise clients across three major geographic regions. A standout strategic argument is made on Slide 4, where CSOD contrasts its unified product suite against the fragmented, acquisition-heavy portfolios of major competitors like SAP and Oracle. The de…
Key takeaways
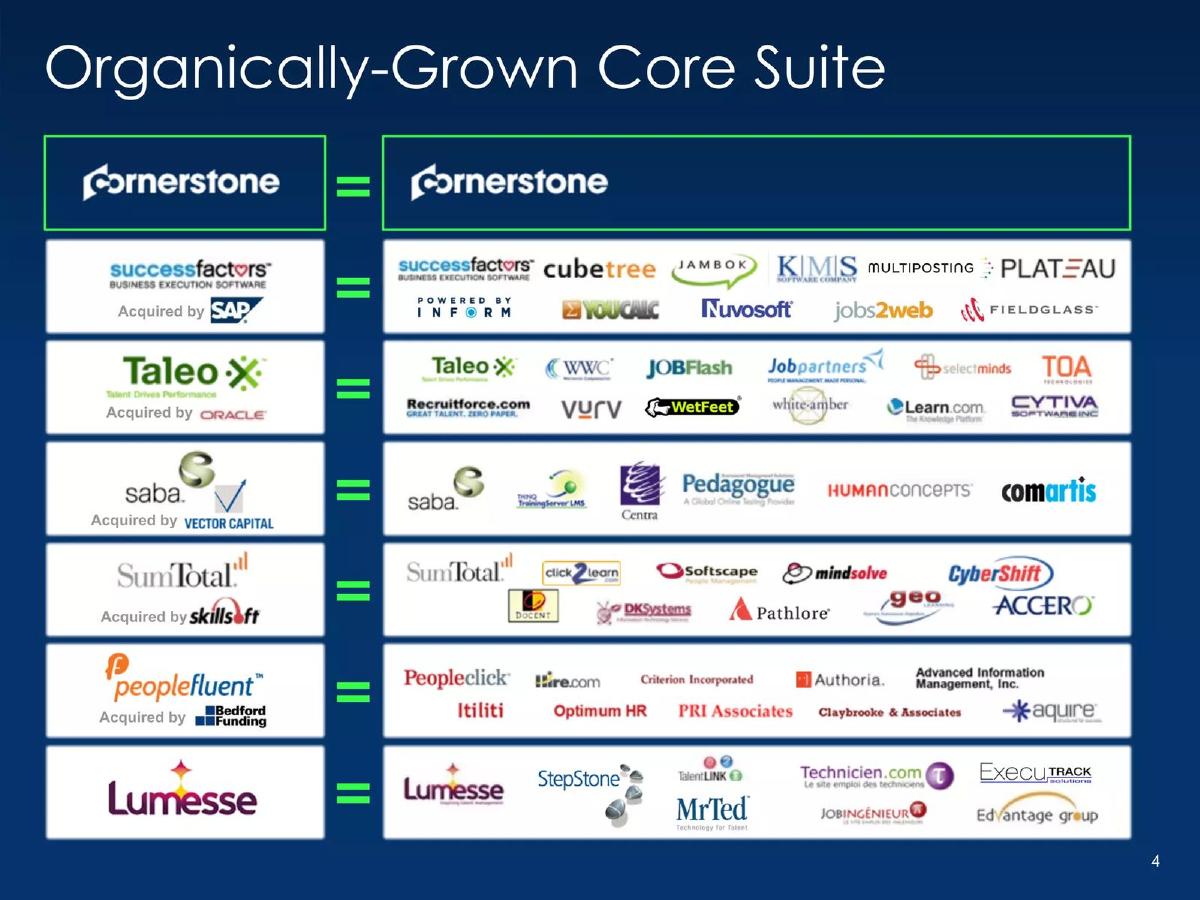
- The deck positions Cornerstone as an 'Organically-Grown Core Suite' to differentiate from competitors who scaled via acquisition (Slide 4).
- CSOD demonstrates deep enterprise penetration by listing integrations with major ERP players like Oracle, SAP, and Workday (Slide 7).
- The company utilizes a massive logo wall to prove global scale, categorized by US & LATAM, EMEA, and APJ regions (Slide 15).
- The 'Work is Changing' slide uses five icons (Who, What, Where, When, How) to frame the macro problem without using dense text (Slide 10).
- Financial transparency is prioritized through a multi-year bar chart showing Non-GAAP Net Profit Margin trends from 2010 to 2017E (Slide 19).
- The deck highlights a successful transition from a -21.9% margin in 2010 to a projected 4.5% positive margin in 2017 (Slide 19).
- Competitive analysis is performed visually by showing the 'messy' acquisition histories of seven major industry rivals (Slide 4).
- The presentation follows a standard corporate structure, moving from product philosophy to market presence and finally to financial results (Slides 1-21).
Executive Summary: The Enterprise Stability Play
The Q1 2017 Cornerstone OnDemand (CSOD) investor deck is a study in enterprise positioning. At this stage in its lifecycle, the company was no longer a scrappy startup trying to prove a concept; it was a public entity defending its moat against legacy giants like Oracle and SAP. The deck focuses on three pillars: architectural purity (organic growth), global dominance (the logo wall), and financial discipline (the path to profitability).
Slide 1: Title Slide
The deck opens with a standard corporate title slide: "Corporate Overview, First Quarter 2017." It features the Cornerstone logo with the tagline "realize your potential." The design is minimalist, using a dark blue gradient that signals professional, enterprise-grade software.
Slide 4: Organically-Grown Core Suite
This is arguably the most strategic slide in the deck. It uses a visual equation to compare Cornerstone to its competitors. On the left, it lists major players: SuccessFactors, Taleo, Saba, SumTotal, PeopleFluent, and Lumesse. On the right, it shows the 'reality' of those companies—a cluttered field of acquired logos (e.g., SuccessFactors is shown as a combination of 10 different companies like Jobs2Web and Plateau). Cornerstone, by contrast, is shown as a single, unified logo. The message is clear: Cornerstone is a single, integrated platform, while competitors are a patchwork of disparate technologies acquired over time.
Slide 7: The Ability to Integrate with Everyone
Recognizing that large enterprises rarely use a single vendor for everything, Slide 7 addresses the 'coexistence' strategy. It highlights that Cornerstone integrates with the three biggest names in the space: Oracle, SAP, and Workday. Below each giant, CSOD lists major clients using these integrations, such as Santander (Oracle), Novartis (SAP), and Nissan (Workday). This mitigates the risk of a 'rip and replace' conversation by positioning Cornerstone as a necessary layer that sits on top of existing infrastructure.
Slide 10: Work is Changing
This slide functions as the macro-economic justification for the product. Against a pixelated world map, five green circles highlight the changing dimensions of labor: Who, What, Where, When, and How. It is a high-level conceptual slide intended to prompt a discussion about the 'future of work' and how legacy systems are ill-equipped to handle the shift toward mobile, global, and flexible workforces.
Slide 15: CSOD has Marquis Clients Across the Globe
This is a classic 'social proof' slide. It is divided into three geographic columns: US & LATAM, EMEA (Europe, Middle East, Africa), and APJ (Asia Pacific Japan). The sheer volume of logos—ranging from The American Red Cross and Papa Johns to BNP Paribas and Hitachi—is intended to overwhelm the viewer with the fact of Cornerstone's market ubiquity. It proves that the software is localized for different languages, regulations, and corporate cultures globally.
Slide 18: Financial & Operating Results
A simple transition slide that signals the shift from product and market strategy to hard numbers. The use of the 'C' monogram logo maintains brand consistency.
Slide 19: Proven Path to Profitability
This slide provides the 'bottom line' for investors. It displays a bar chart of Non-GAAP Net Profit Margin from 2010 through a 2017 estimate. The chart shows a clear, upward trajectory. In 2010, the margin was -21.9%. By 2013, it had narrowed to -7.5%. The company hit a turning point in 2016 with a 1.5% positive margin and projected 4.5% for 2017. A footnote clarifies that these figures reflect updated SEC guidance and revenue midpoint ranges. This slide is designed to build confidence that the company has successfully scaled and is now focused on returning value to shareholders.
What Cornerstone Does Well
Visual Competitive Differentiation: Slide 4 is a masterclass in competitive positioning. By visualizing the 'mess' of acquisitions that competitors represent, they turn a competitor's size into a weakness (complexity) and their own focus into a strength (simplicity and integration).
Global Proof Points: The segmentation of clients by region on Slide 15 is vital for an enterprise SaaS company. It proves they aren't just a US-centric company, which is a common concern for international investors and global conglomerates.
Narrative of Discipline: The financial chart on Slide 19 doesn't hide the years of losses. Instead, it uses them to create a narrative arc of 'proven' progress. It shows that the losses were an investment phase that has now reached a profitable conclusion.
What is Missing from the Deck
Product Deep Dive: While the deck mentions an 'Organically-Grown Core Suite,' it doesn't actually show the product. There are no screenshots, no feature lists, and no specific modules (like Learning, Performance, or Recruiting) mentioned in these slides. It assumes the audience already knows what Cornerstone does.
Team Slide: In the provided selection, there is no mention of the leadership team or the board. For a public company, the CEO and CFO's track records are often as important as the metrics themselves.
Unit Economics: While the deck shows net profit margin, it omits standard SaaS metrics like CAC (Customer Acquisition Cost), LTV (Lifetime Value), or Churn rates. These are the 'under the hood' numbers that professional investors use to determine the quality of the growth.
Founder Takeaways
Use 'Frankensuite' to your advantage: If you are building a unified platform in a market dominated by companies that grow through acquisition, use a visual like Slide 4 to highlight your architectural superiority. · Address the 'Elephant in the Room': Cornerstone knows their clients use SAP or Workday. Instead of fighting them, they dedicated Slide 7 to showing how well they play together. Don't be afraid of your competitors' footprints; show how you augment them. · Show the Trend, Not Just the Point: A single year of profit is a data point. A seven-year chart showing a narrowing gap between loss and profit (Slide 19) is a story. Always provide context for your financial state. · Logo Organization Matters: Don't just throw logos on a page. Categorizing them by industry or geography (as seen on Slide 15) tells a much more powerful story about your market reach and operational maturity.
Frequently asked questions
- What is the primary competitive advantage claimed in this deck?
- The primary advantage is organic growth. On Slide 4, Cornerstone explicitly compares its single, unified logo against competitors like SuccessFactors (SAP) and Taleo (Oracle), which are shown as clusters of 10+ acquired companies. This implies that Cornerstone’s platform is more cohesive and less prone to the integration headaches associated with 'Frankensuite' software architectures.
- How does Cornerstone prove its ability to serve large enterprises?
- Cornerstone uses two methods: integration and client lists. Slide 7 shows they integrate with the three largest HCM/ERP providers (Oracle, SAP, Workday), proving they can coexist in complex IT environments. Slide 15 then provides a massive list of 'Marquis Clients' including brands like Heineken, Philips, and Nissan, validating their ability to handle global scale.
- What is the significance of the 'Work is Changing' slide?
- Slide 10 serves as the 'Problem/Market Trend' slide. Instead of listing statistics, it uses icons to represent the shifting nature of the workforce (Who, What, Where, When, How). It sets the stage for why a modern talent management system is necessary in a world of remote work, mobile access, and changing demographics.
- What do the financial results indicate about the company's stage?
- The company is in a 'maturation' phase. Slide 19 shows a steady climb out of significant losses (-21.9% in 2010) toward consistent profitability. By 2016, they reached a 1.5% margin, with a 4.5% projection for 2017. This tells investors that the period of high-burn customer acquisition is evolving into a period of sustainable cash flow.
- Is there a specific 'Ask' or valuation mentioned in these slides?
- No. As this is a 'Corporate Overview' for a public company (CSOD), it functions as an earnings-adjacent investor relations deck rather than a venture capital pitch. It focuses on performance metrics and strategic positioning rather than a specific request for capital or a valuation cap.