The 2017 Cornerstone OnDemand (CSOD) investor deck is a high-level corporate overview designed for a public or late-stage audience, emphasizing market leadership and operational efficiency. With 3,000 clients and over 31 million users as of March 2017, the company positions itself as the dominant force in the Talent Management Suite market, specifically highlighting its ability to integrate with major ERP providers like Oracle, SAP, and Workday. The financial narrative is one of consistent scaling, showing a revenue CAGR that took the company from under $20 million to over $420 million in eig…
Key takeaways
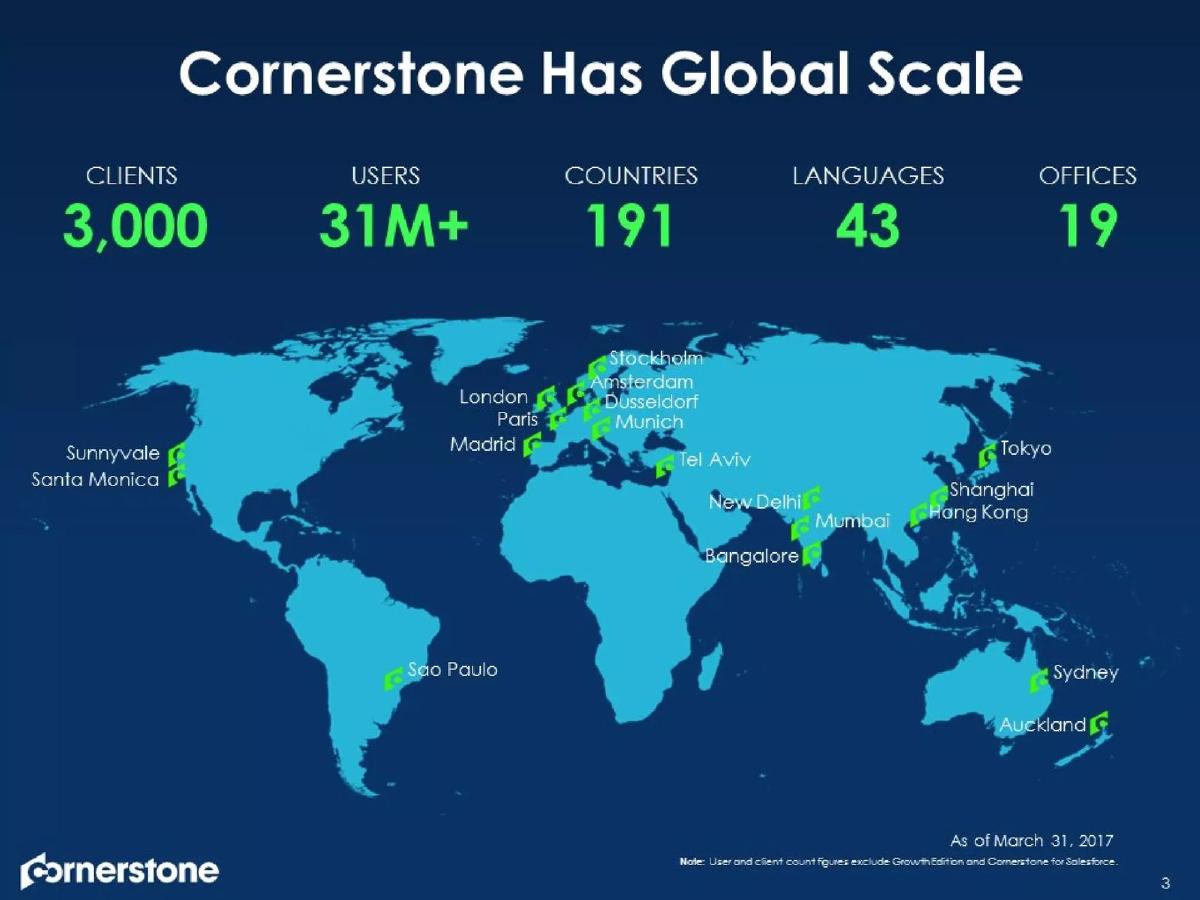
- Cornerstone reports a global presence with 3,000 clients and 31M+ users across 191 countries as of March 31, 2017 (Slide 3).
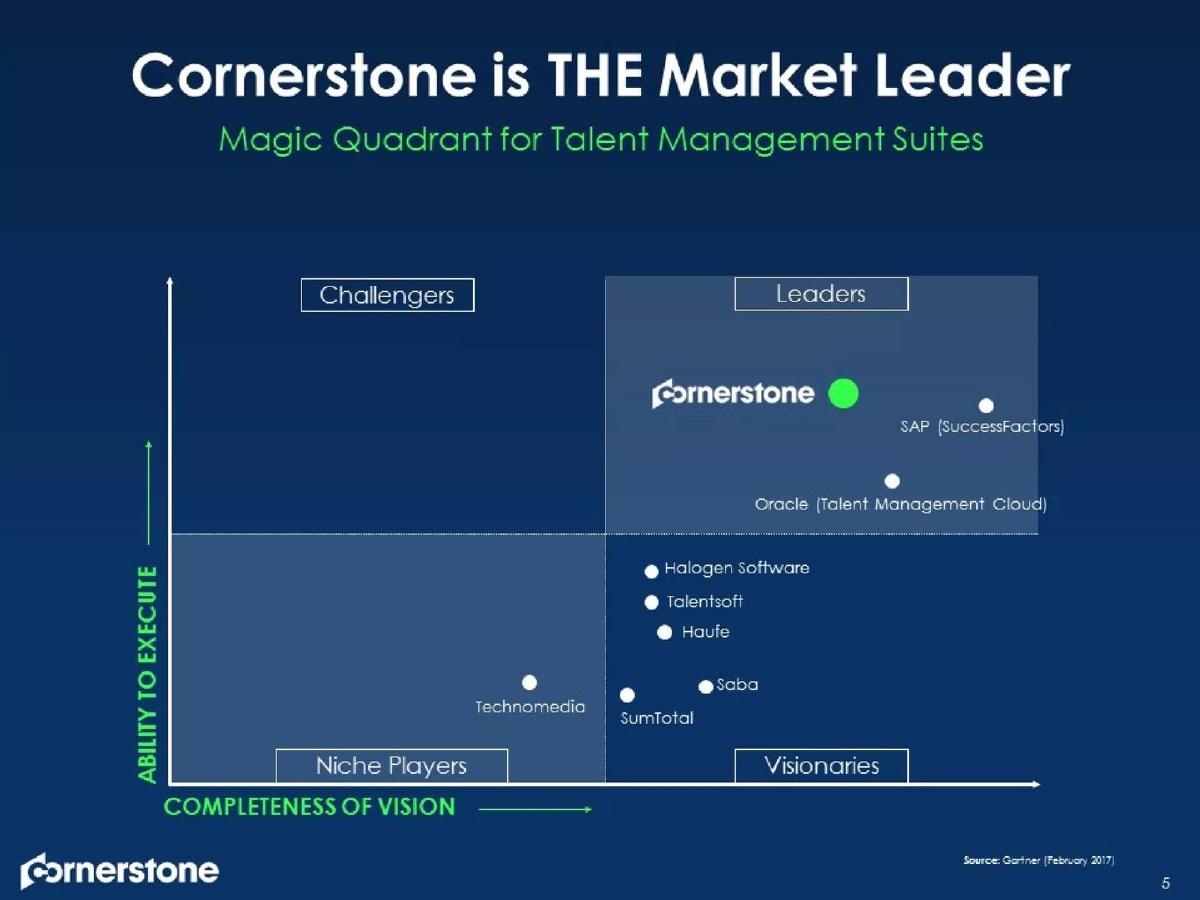
- The company utilizes the Gartner Magic Quadrant to position itself as the leader in Talent Management Suites, placing higher on 'Ability to Execute' than SAP and Oracle (Slide 5).
- A dedicated slide emphasizes the platform's ability to integrate with major ecosystems including Oracle, SAP, and Workday (Slide 7).
- Market validation is established through five major press features from 2017, including Harvard Business Review and Forbes (Slide 11).
- The client roster is segmented by region (US & LATAM, EMEA, APJ), featuring brands like Visa, Maersk, and Nissan (Slide 13).
- Revenue growth is shown as a consistent upward trajectory, reaching $423.1 million in 2016 (Slide 17).
- User growth scaled from 2.1 million in 2008 to 29.9 million by the end of 2016 (Slide 17).
- The company projected an operating margin improvement from 2% in 2016 to 10%+ by 2018E (Slide 19).
Executive Summary: The Enterprise Powerhouse
The Cornerstone OnDemand (CSOD) Corporate Overview for Q2 2017 is a textbook example of how an established SaaS leader communicates scale and reliability to the market. Unlike early-stage decks that must fight for every inch of credibility, this deck operates from a position of dominance. The narrative is built on three pillars: global reach, third-party validation, and consistent financial compounding. By the time an investor reaches the final slides, the message is clear: Cornerstone is the infrastructure of modern talent management.
Slide 1: Title Slide
The deck opens with a minimalist blue aesthetic, identifying itself as the "Corporate Overview" for the "Second Quarter 2017." The logo includes the tagline "realize your potential," signaling a focus on human capital and talent development.
Slide 3: Cornerstone Has Global Scale
This is the primary credibility slide. It lists five key metrics as of March 31, 2017: 3,000 clients , 31M+ users , 191 countries , 43 languages , and 19 offices . A world map highlights office locations ranging from Santa Monica and London to Mumbai and Auckland. A small footnote clarifies that these figures exclude the "Growth Edition" and "Cornerstone for Salesforce," suggesting the core enterprise business is even more concentrated than the numbers imply.
Slide 5: Market Leadership via Gartner
Cornerstone utilizes the Gartner Magic Quadrant for Talent Management Suites (February 2017). The slide places Cornerstone firmly in the "Leaders" quadrant. Notably, it positions itself higher on the "Ability to Execute" axis than major competitors like SAP (SuccessFactors) and Oracle (Talent Management Cloud). This visual shorthand effectively dismisses smaller "Niche Players" and "Visionaries" like Saba or SumTotal by showing them far behind in both vision and execution.
Slide 7: The Ability to Integrate with Anyone
This slide addresses a common enterprise objection: interoperability. By grouping logos under headers for Oracle , SAP , and Workday , Cornerstone demonstrates that it doesn't replace these systems; it enhances them. The slide features high-profile logos such as Santander, Novartis, Nissan, and the UNHCR, proving that the world's largest organizations trust Cornerstone to sit alongside their existing ERP stacks.
Slide 9 & 11: The Opportunity and Market Need
Slide 9 serves as a section breaker titled "Our Opportunity." Slide 11 follows with "The Market Need is Real," using external media validation instead of internal claims. It features headlines from Entrepreneur Magazine, The Huffington Post, Harvard Business Review, Fortune, and Forbes, all dated between January and March 2017. The themes focus on personalizing the employee experience and the changing nature of work, framing Cornerstone's software as the solution to these macro trends.
Slide 13: Marquis Clients Around the World
This is a "wall of logos" slide, but it is organized geographically: US & LATAM, EMEA, and APJ. The sheer volume of logos—including Walgreens, Heineken, Visa, BNP Paribas, Deutsche Bank (implied by logos like BBVA and Bankinter), and Cathay Pacific—serves to overwhelm any doubt regarding product-market fit. It demonstrates that the software is culturally and operationally flexible enough to work in any regulatory environment.
Slide 15 & 17: Financial and Operating Results
Slide 15 introduces the financial section. Slide 17, "Growth Across All Metrics," provides three bar charts showing performance from 2008 to 2016. Revenue Growth moved from $19.6 million to $423.1 million. Client Growth scaled from 168 to 2,918. User Growth expanded from 2.1 million to 29.9 million. The consistency of the bars—each year higher than the last—creates a visual sense of inevitability and low risk.
Slide 19: Continuing to Grow Margins
The final slide in this selection focuses on the transition from growth to profitability. It compares 2016 actuals to 2018 estimates (2018E). Key targets include increasing Gross Margin from 71% to 74-75% and significantly improving the Operating Margin from 2% to 10%+. It also notes a target Free Cash Flow Margin of less than 16% for 2019. This slide is designed to satisfy investors looking for evidence of operating leverage as the company matures.
What Works in the Cornerstone Deck
The use of third-party validation is the deck's strongest suit. By leaning on Gartner and major news publications, Cornerstone avoids the "we say we are great" trap and instead presents a "the world says we are great" narrative. The geographic segmentation of clients is also highly effective; it proves the company has solved the difficult challenges of localization and international sales, which is a major hurdle for SaaS companies looking to reach the $500M+ revenue mark.
Furthermore, the financial charts on Slide 17 are exceptionally clean. By showing an 8-year history, they demonstrate resilience through different market cycles. The focus on margin improvement in Slide 19 shows that management is disciplined and focused on the bottom line, not just top-line growth at any cost.
What is Missing
As a corporate overview, this deck assumes the viewer already knows what Cornerstone does. There is no product overview —no screenshots of the interface, no list of specific modules (like Learning, Performance, or Recruitment), and no explanation of the underlying technology. While this is appropriate for an investor audience familiar with the ticker CSOD, a new investor would need a separate product brief to understand the actual user experience.
There is also no mention of the leadership team in these slides. In a corporate setting, the CEO and CFO's track records are vital. Finally, there is no competitive landscape beyond the Gartner chart. While the chart shows where competitors sit, it doesn't explain why Cornerstone wins against them in head-to-head deals.
Founder Takeaways: What to Copy
Use the 'Integration' Slide: If your product lives within a larger ecosystem, show the logos of the platforms you integrate with. It reduces the perceived risk of adoption. · Leverage External Press: Instead of writing your own 'Problem' slide, use headlines from reputable sources to show that the market is already talking about the issue you solve. · Long-term Charting: If you have more than three years of data, show it. The longer the trend line of growth, the more it looks like a law of nature rather than a lucky streak. · Margin Targets: Don't just show where your margins are; show where they are going and the specific 'Improvement' delta you expect to achieve.
Frequently asked questions
- What is the primary value proposition of Cornerstone according to this deck?
- The deck focuses on 'Global Scale' and 'Market Leadership.' It positions Cornerstone as the premier Talent Management Suite that can integrate with any existing enterprise infrastructure (Oracle, SAP, Workday). The value is not just in the software itself, but in its proven ability to serve 3,000 large-scale clients across 191 countries and 43 languages.
- How does Cornerstone handle competition in the deck?
- Cornerstone uses the Gartner Magic Quadrant (Slide 5) to objectively place itself in the 'Leaders' category. By showing its position relative to giants like SAP and Oracle, it frames the competition not as threats to be feared, but as legacy systems that Cornerstone successfully complements or outperforms in execution.
- What do the financial metrics reveal about the company's stage?
- The company is in a mature scaling phase. With 2016 revenue at $423.1 million and a client count of nearly 3,000, it has moved past early-stage volatility. The focus on Slide 19 shifts from raw growth to margin expansion, specifically targeting a move from a 2% operating margin to over 10%.
- Is there a specific 'Ask' or 'Use of Funds' in this deck?
- No. This is a 'Corporate Overview' deck for Q2 2017, likely used for quarterly earnings support or general investor relations rather than a specific venture capital round. It focuses on historical performance and future margin projections rather than a request for new capital.
- What is missing from this deck that a startup would usually include?
- The deck lacks a 'Problem' slide, a 'Solution' (product demo) slide, and a 'Team' slide. Because Cornerstone was a well-established public entity (CSOD) at this time, it relies on brand recognition and financial history rather than the typical startup narrative of identifying a gap in the market.